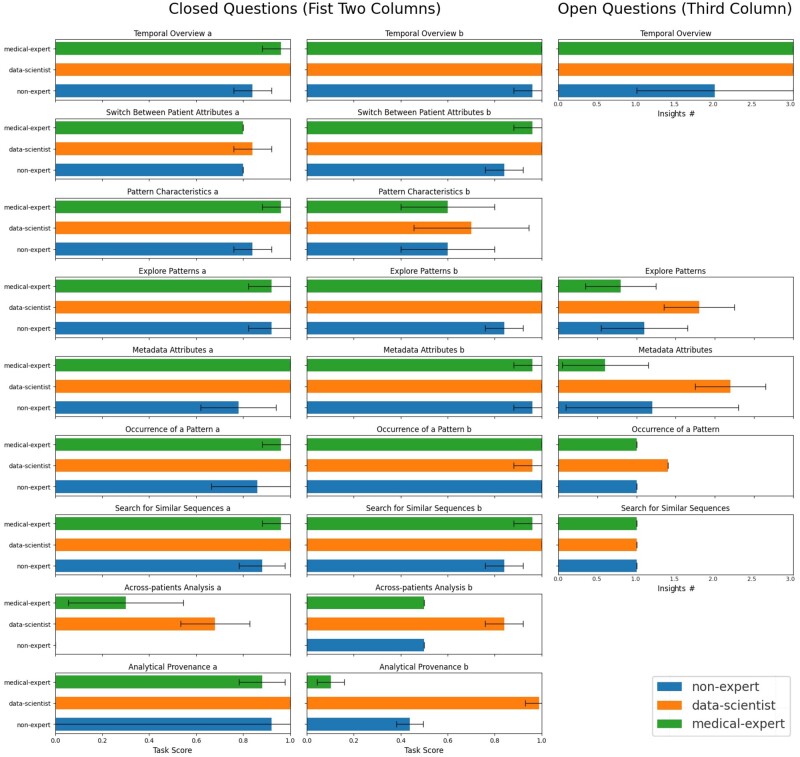
Figure 6:
Results of the user study. From left to right: Column 1 and 2: Task scores for the closed questions across user groups, represented as colored bars. Each question charted shows the average score of a user group’s participant, with error bars indicating the standard error. Participants generally had the most difficulty solving across-patients analysis, with no considerable performance differences between user groups. Column 3: Task score for the open questions across user groups, represented as colored standard error bars with a capped global maximum of 3 insights. Overall, data scientists made more insights than both non-experts and medical experts.

