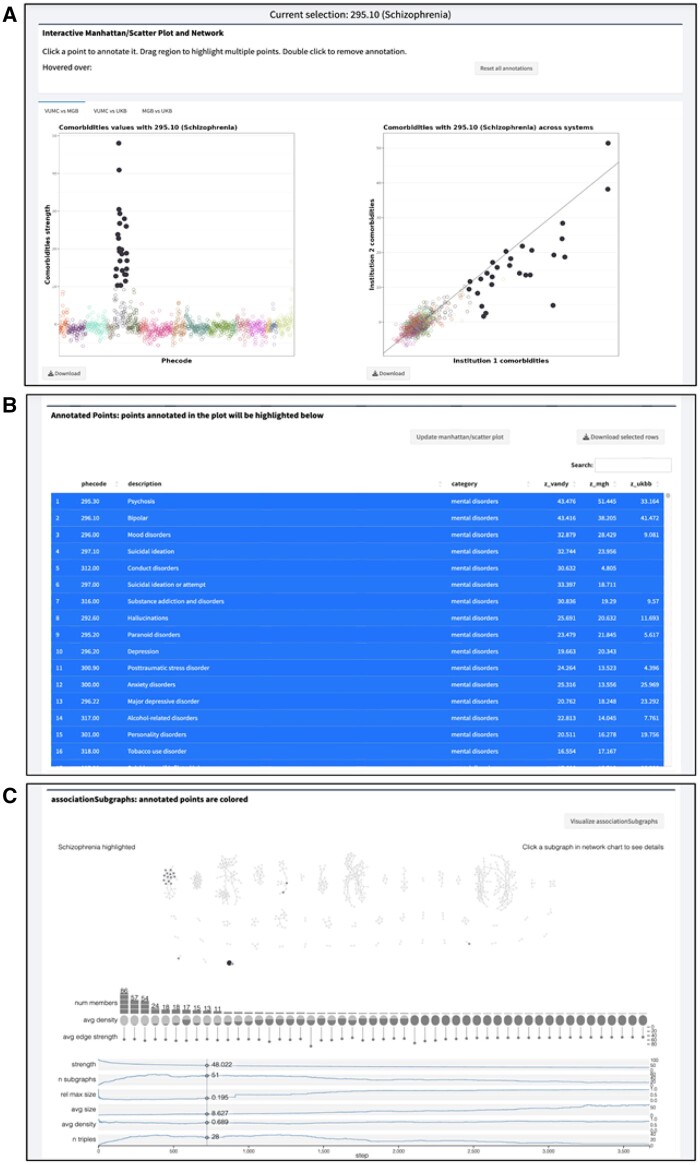
Figure 1.
Reproducible multimorbidity exploration analysis outline for schizophrenia. (A) Interactive Manhattan and scatter plot enable users to select top-co-occurred and consistent disease phenotypes. (B) Interactive table allows users to add or remove disease phenotypes by clicking on the rows in the table and incorporate the updated phenotypes into the final selection by clicking the Update Manhattan/Scatter button, highlighting the user-selected phenotypes. (C) Enhanced associationSubgraphs provides dynamic network analysis to explore disease clusters, highlighting the user-selected phenotypes from part A and B, and their corresponding subgraphs.

