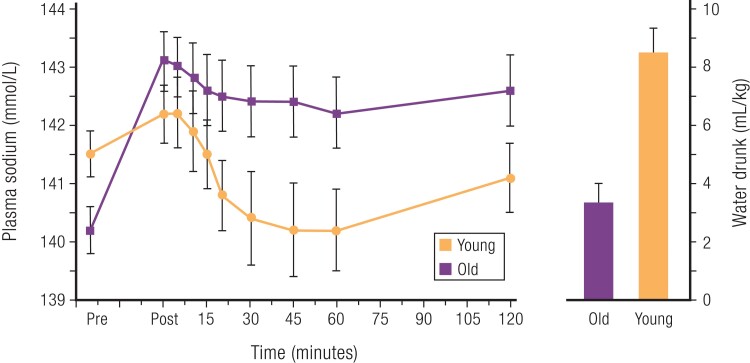
Figure 11.
Plasma sodium concentration (Na+]) and total water intake in healthy older and younger subjects following 24 hours of dehydration. Baseline sodium concentrations before dehydration (Pre) and after dehydration (Post) are shown. Free access to water was allowed for 60 minutes following dehydration starting at time = 0 minutes. Cumulative water intake during the free drinking period by young and old subjects is depicted in the bar graph. Despite a greater initial increase in serum [Na+], older participants drank significantly less water, resulting in lesser correction of the elevated serum [Na+]. Redrawn with permission from Phillips PA, Johnston CI, & Gray L. Thirst and fluid intake in the elderly. In Ramsay DJ, Booth DA eds., Thirst: Physiological and Psychological Aspects. London; Springer-Verlag, 1991. © Springer-Verlag London Limited.

