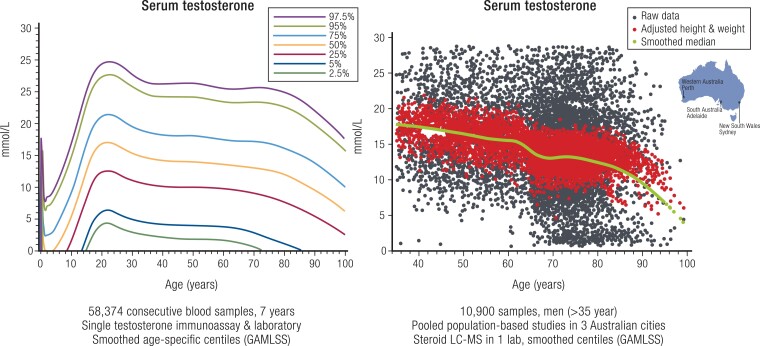
Figure 5.
Age-specific profile of serum testosterone in men. Left panel comprises 58 374 consecutive serum samples over 7 years measured in a single immunoassay and pathology laboratory with population centiles deduced by smoothed GAMLSS methodology. Right panel comprises 10 900 serum samples pooled from 3 population-based Australian studies showing the raw scatter (black dots), height and weight-adjusted scatter (red dots), and the smoothed median (green solid line) deduced by GAMLSS methodology. Redrawn and adapted from Handelsman DJ et al Ann Clin Biochem, 2015; 53(3):377-385, © SAGE Publications (left), and redrawn from Handelsman DJ et al (168), © 2015 European Society of Endocrinology (right).

