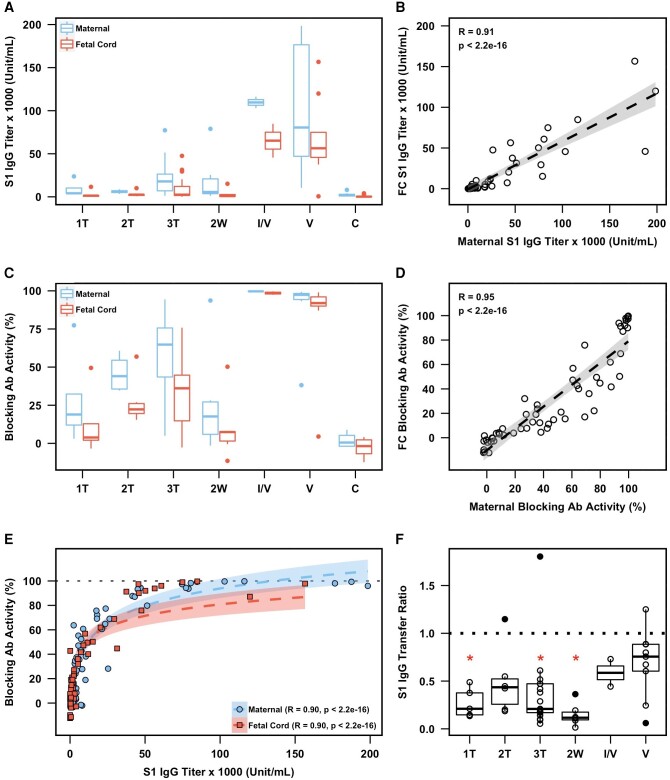
Figure 2.
Maternal and fetal cord blood antibody responses. A, Anti–spike S1 protein IgG titers in maternal plasma (blue) and FC plasma (red). B, Paired maternal and FC anti–spike S1 IgG titers, including best-fit linear regression. C, RBD-hACE2 blocking antibody activity in maternal plasma (blue) and FC plasma (red). D, Paired maternal and FC RBD-hACE2 blocking antibody activity, including best-fit linear regression. E, Paired anti–spike S1 IgG titers and RBD-hACE2 blocking antibody activity faceted by maternal (blue circles) and FC (red squares) plasma. Panel includes best-fit logarithmic regressions. F, Anti–spike S1 IgG transfer ratios (FC plasma to maternal plasma) of pregnant women infected in the first, second, and third trimesters (1T, 2T, 3T) and 2 weeks prior to delivery (2W), as well as infected and vaccinated (I/V) and vaccinated (V) individuals. Mann-Whitney U test (vs vaccinated group): *P < .05. A, C, F, Data are graphed by median (line) and IQR (box). B, D, E, Data include coefficient of correlation (R; dotted line), 95% CI (shading), and unadjusted P value computed by the Spearman rank correlation test. Ab, antibody; C, pregnant uninfected controls; FC, fetal cord; RBD-hACE2, receptor-binding domain–human angiotensin-converting enzyme 2.

