8.

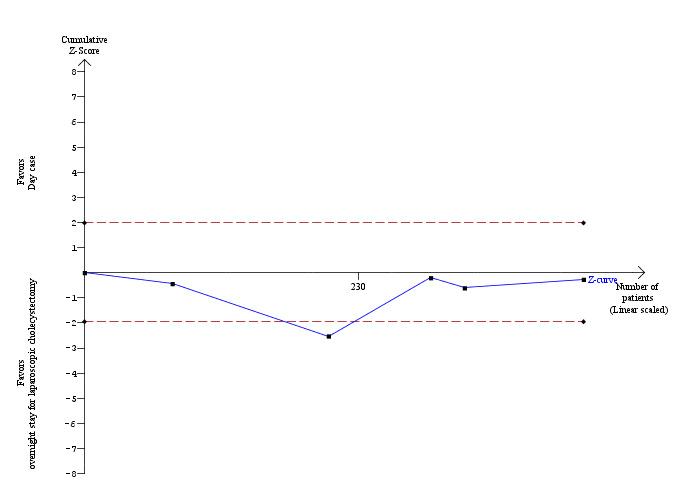
Trial sequential analysis of proportion of participants with failed discharge The diversity‐adjusted required information size (DARIS) was calculated to 15,968 participants, based on the proportion of participants in the control group with the outcome of 20.09%, a relative risk reduction of 20%, an alpha of 5%, a beta of 20%, and a diversity of 81.98%. To account for zero event groups, a continuity correction of 0.01 was used in the calculation of the cumulative Z‐curve (blue line). After accruing 419 participants in the five trials, only 2.62% of the DARIS has been reached. Accordingly, the trial sequential analysis program does not show the required information size and the trial sequential monitoring boundaries. As shown, the conventional statistical boundaries have also not been crossed at the end of five trials although the cumulative Z‐curve crossed temporarily the conventional statistical boundary favouring overnight stay after two trials. Such a finding is likely to be a random error.
