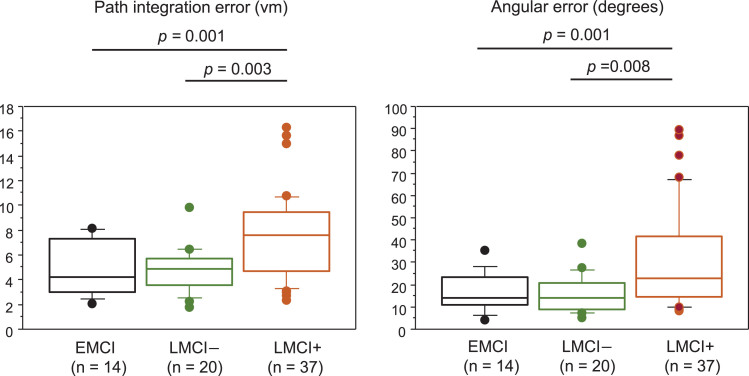
Fig. 2.
Path integration performance in patients with EMCI, LMCI–, and LMCI+. Box and Whisker plots showing the distribution of path integration error (A) and angular error (B) in patients with EMCI, LMCI–, and LMCI+. The median is represented as line located in the middle of the box. The top and bottom of the box are the 75th and 25th percentiles respectively, and the ends of the whiskers are the 75th (or 25th) percentile±1.5×interquartile range. The circle represents outliers. EMCI, early MCI; LMCI–, late MCI with an AD score of less than 2; LMCI+, late MCI with an AD score of 2 or higher.

