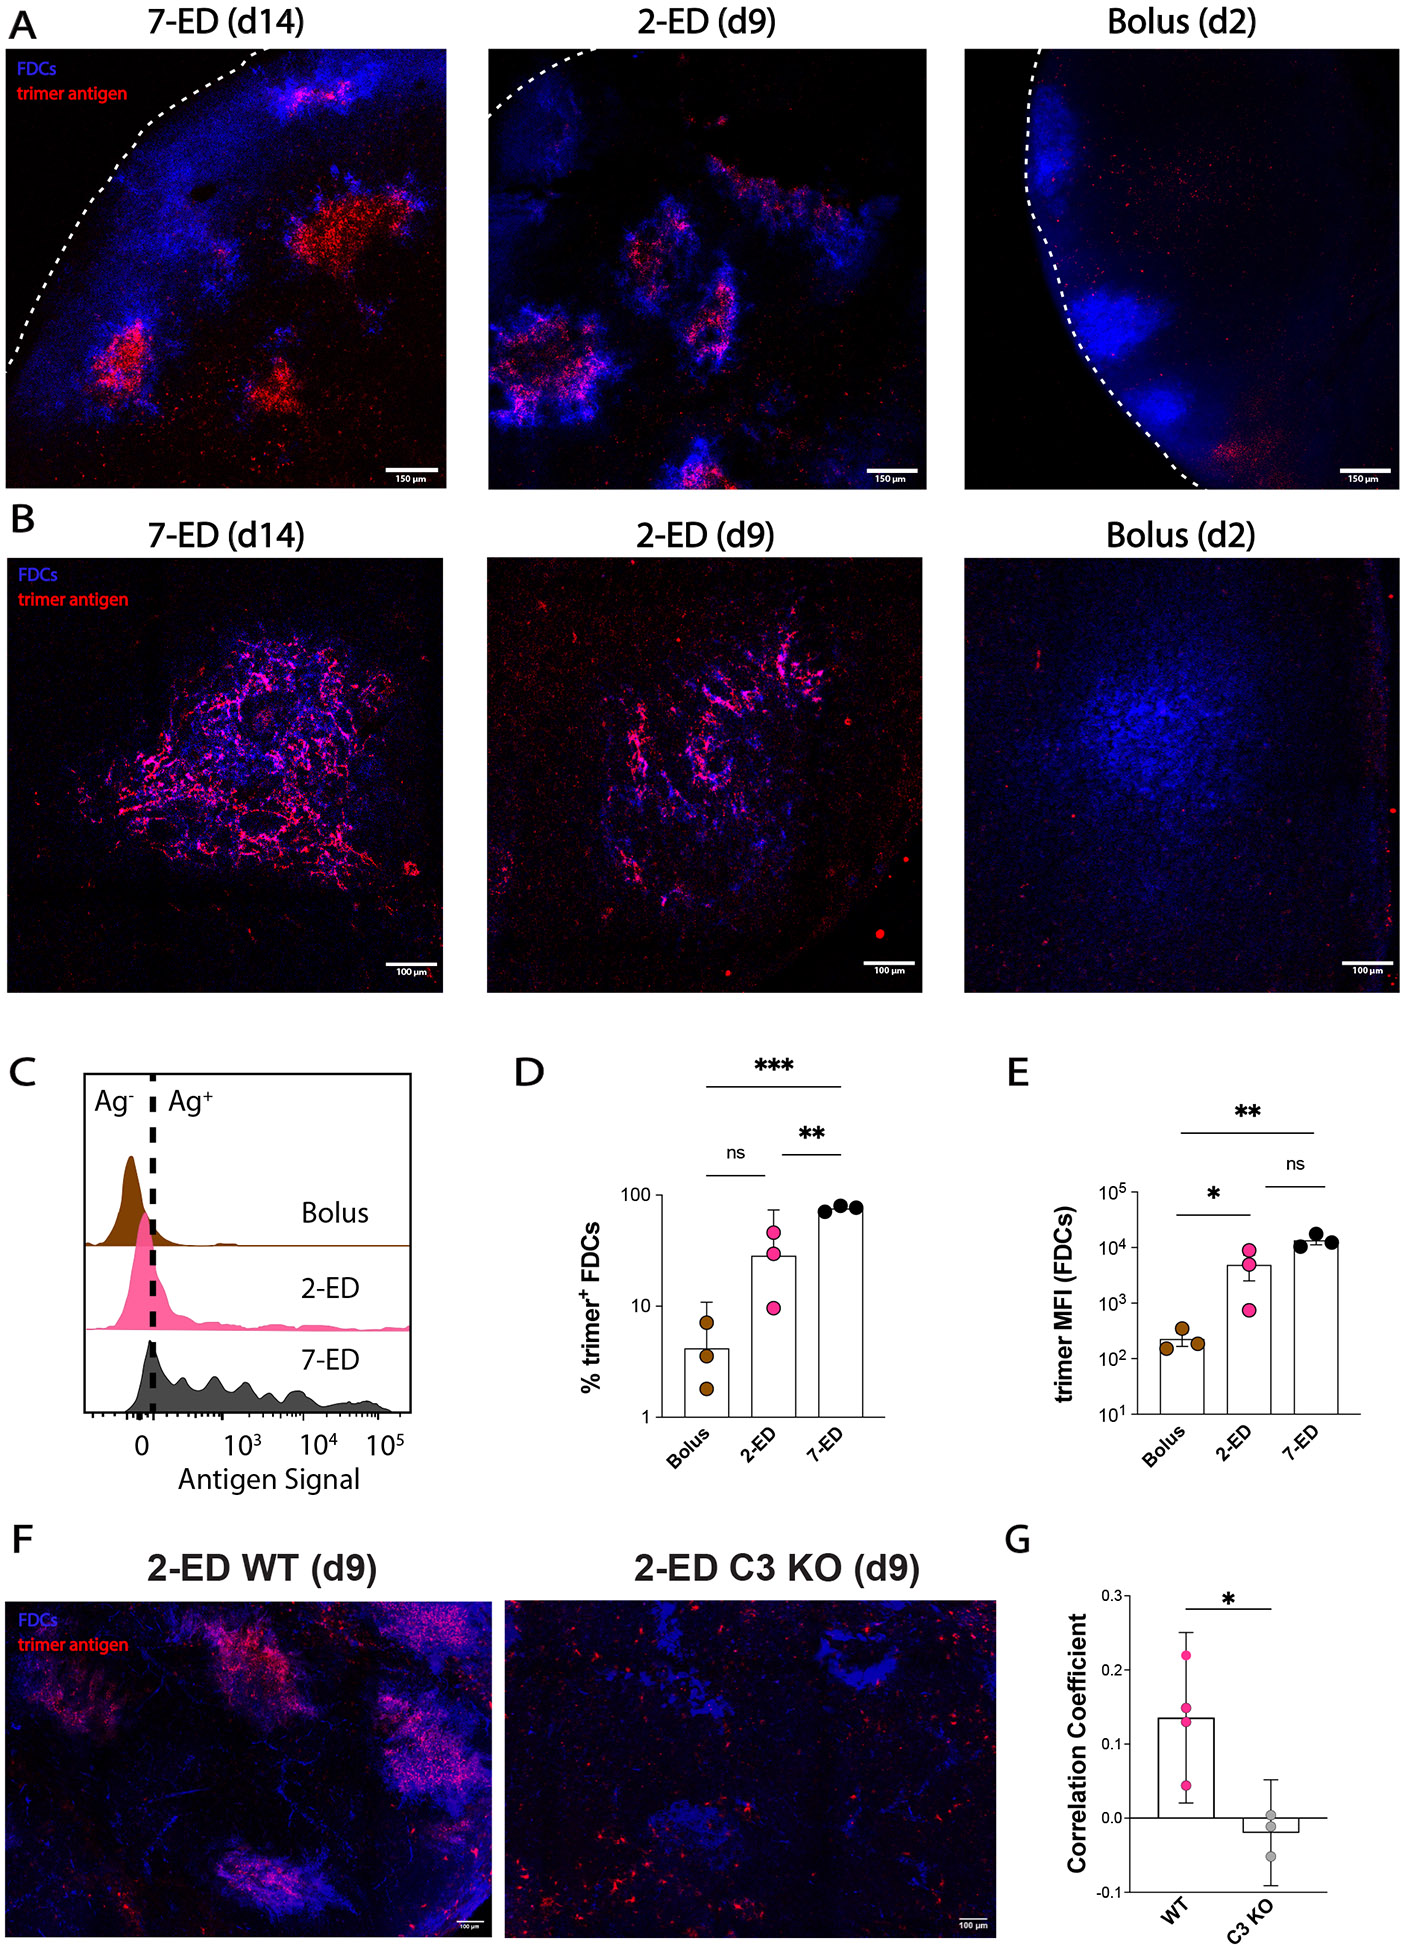
Figure 5. Two-dose extended prime immunization enables antigen capture of the second shot on FDCs.

(A-B) Groups of C57BL/6 mice (n=3 animals/group) were immunized by bolus, 2-ED, or 7-ED regimens as in Fig. 3G followed by collection of lymph nodes for imaging at 48 h after bolus or after the last injection of 2-ED and 7-ED regimens. FDC networks were labeled in situ by s.c. injection of anti-CD35 antibody 16h before tissue collection. Collected tissues were clarified and imaged intact by confocal microscopy; shown are maximum intensity projections from z-stacks through FDC clusters (Scale bars, 150 μm), (A). Alternatively, lymph node sections were stained for FDCs (CD35; blue) and then analyzed by confocal microscopy (Scale bars, 300 μm) to detect co-localization with Cy5-labeled N332-GT2 (pink), (B). (C-E) Flow cytometry analysis of LN cells (n=3 pools/group, with each pool containing six LNs from 3 mice) isolated 48 hr after the final injection following immunization with fluorescently labeled N332-GT2 (10 ug) and SMNP (5 ug) using either bolus, 2-ED, or 7-ED dosing regimens. Shown are representative histograms of antigen intensities among LN cells (C), frequencies of trimer+ FDCs (D), and the mean trimer fluorescence intensity among trimer+ FDCs (E) for the indicated immunization conditions. Shown are data from one independent experiment for each immunization series. (F-G) C57BL/6 WT and complement-deficient (C3 knockout) mice (n=3-4 animals/group) were immunized by 2-ED regimen with Cy5-labeled antigen followed by collection of lymph nodes for imaging 48h later. BV421-tagged anti-CD35 was injected 16h prior to tissue collection for FDC labeling. Collected tissues were clarified and imaged intact by confocal microscopy. (F) Maximum intensity projections from z-stacks of WT (left) and C3 knockout (right) mice (Scale bars, 100 um). (G) Quantification of N332:anti-CD35 signal colocalization as determined by Pearson's correlation. ****, p < 0.0001; ***, p < 0.001; **, p < 0.01; *, p < 0.05; ns, not significant; by one-way ANOVA with Dunnett’s multiple comparison post test compared to bolus immunization.
