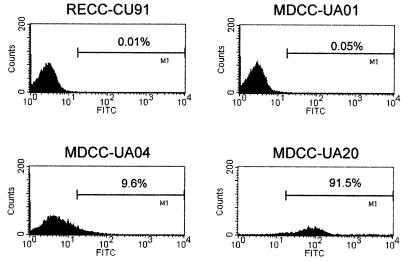
FIG. 11.
Spontaneous expression of smGFP in MDCC-UA20 cells. Histogram plots of flow cytometry data are shown depicting the number and fluorescence intensity of GFP-expressing lymphoblastoid cells. The x axis denotes arbitrary fluorescence units (log scale) for the FL-1 (fluorescein isothiocyanate [FITC], GFP) channel, and the y axis denotes cell number. For each plot, 104 cells were acquired. The cell lines used were RECC-CU91, a REV-transformed T-lymphoblastoid cell line (53); MDCC-UA01, an RB1B-transformed T-lymphoblastoid cell line (18); MDCC-UA04, an RB1BUS2gfpΔ-1-transformed T-lymphoblastoid cell line (18); and MDCC-UA20, an RB1BvIL-8ΔsmGFP-transformed T-lymphoblastoid cell line.

