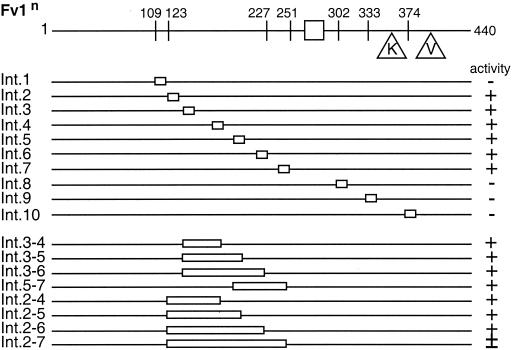
FIG. 5.
Restriction of Fv1n internal deletions. The diagram at the top shows the major features of Fv1n, with the lines below representing mutants. The stretch of sequence deleted is indicated (open boxes). The name of each mutant is shown to the left of each line, and its activity against B-tropic MLV is shown to the right. Symbols indicate the extent of restriction, as follows: +, complete; ±, 50% restriction −, none.

