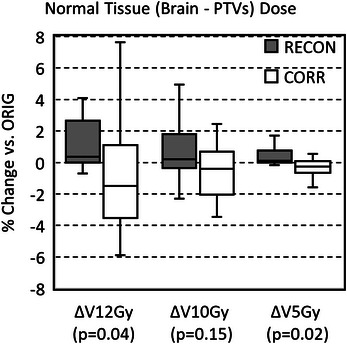
FIGURE 6.

Box‐and‐whisker plots of normalized changes in the volume of normal tissue (brain—PTVs) receiving 12 Gy (ΔV12Gy), 10 Gy (ΔV10Gy), and 5 Gy (ΔV5Gy) resulting from re‐contouring (RECON) and after distortion corrections (CORR), with respect to the original (ORIG) PTVs. The x‐axis labels show p‐values from the Student's t‐test comparing RECON and CORR data.
