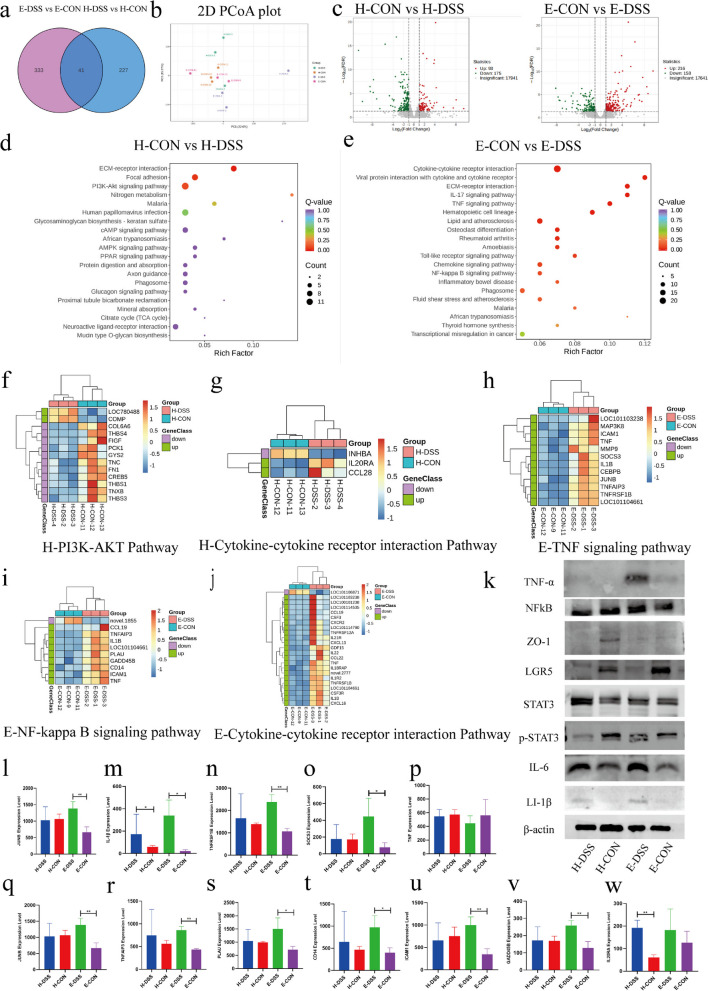
Fig. 3.
RNA-seq analysis was used to explore the mechanism underlying the disease resistance phenotype in the two sheep breeds. a Venn diagram of differentially expressed genes. b PCA map of differentially expressed genes. c Volcano plot of differentially expressed genes. d KEGG enrichment map of differentially expressed genes in Hu sheep. e KEGG enrichment map of differentially expressed genes in East Friesian sheep. f Gene heatmap of the PI3K-AKT pathway in Hu sheep. g Gene heatmap of the cytokine‒cytokine signalling pathway in Hu sheep. h Gene heatmap of the TNF signalling pathway in East Friesian sheep. i Gene heatmap of the NF-kappa B signalling pathway in East Friesian sheep. j Gene heatmap of the cytokine‒cytokine signalling pathway in East Friesian sheep. k Western blotting was used to validate the immune status and intestinal structure in sheep. l–w Relative RNA expression of differentially differentiated genes. The data are presented as the mean ± SEM (n = 3 mice per group) (*P < 0.05, **P < 0.01)

