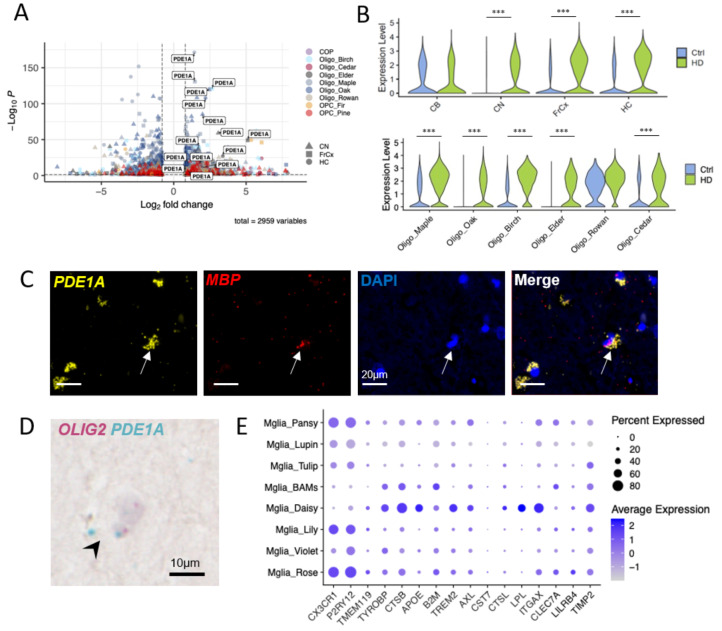
Fig. 3.
PDE1A upregulation in oligodendrocytes in HD (A) We identified upregulation of PDE1A across multiple clusters and regions. (B) Violin plots of expression of PDE1A in different regions and different clusters comparing HD and control donors. Stars represent adjusted p-values from MAST, *** p < 0.001. (C) Duplex RNAScope identification of PDE1A transcript (yellow) in MBP-expressing (red) oligodendroglia in human HD brain. DAPI-stained nuclei in blue. (D) BaseScope identification of PDE1A transcript (blue) in OLIG2 transcript-expressing (pink) oligodendroglia in human HD brain. (E) Dot plot showing expression of immune markers across microglial subclusters

