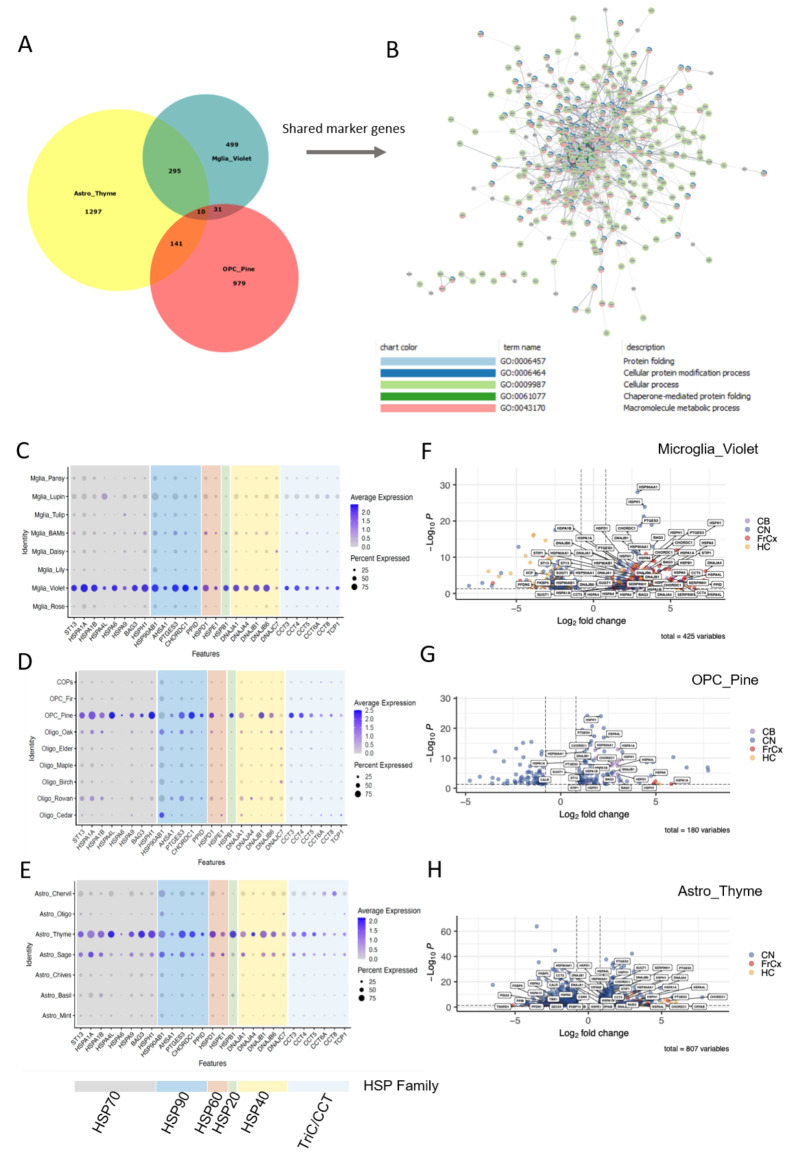
Fig. 5.
Molecular chaperone genes are upregulated across glial clusters in HD. A. Venn Diagram showing overlap of cluster markers between Astro_Thyme, Mglia_Violet and OPC_Pine. B. PPI network of shared cluster markers, coloured to denote genes belonging to one of the top 5 GO terms shown below. C-E. Expression of shared molecular chaperone genes in microglia, marking Mglia Violet (C), oligodendroglia, marking OPC Pine (D) and in astrocytes, marking Astro Thyme (E). Dot plots are colour coded according to chaperone family (key below). F-H. Volcano plots showing differentially expressed genes in Mglia Violet (F), OPC Pine (G) and Astro Thyme (H), labelling altered molecular chaperone genes and regions. Log2FC/p-values from MAST comparing HD and control within each cluster

