Figure 3.

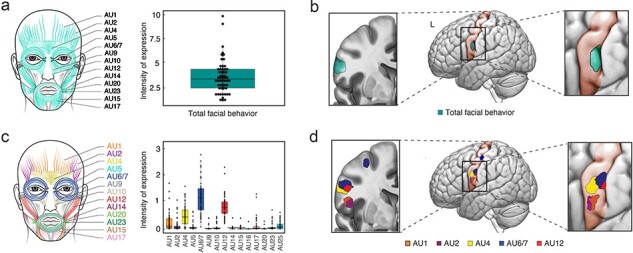
Facial behavior across trials had predominant structural correlates in the precentral gyrus. (a) For each participant, we computed a total facial behavior score by summing the single AU activity scores of all AUs across trials. (b) Greater total facial behavior across trials (all AUs combined) was associated with larger gray matter volume in the left precentral gyrus. (c) For each participant, we computed a single AU activity score for each AU by summing its average activity across all trials. (d) Greater single AU activity score across trials was associated with larger gray matter volume in distinct yet overlapping regions in the bilateral precentral gyrus. For illustration purposes, the clusters (P < .005, uncorrected) without the T-score color gradient are overlaid on the precentral gyrus in the left hemisphere. Adobe Illustrator software was used to create the faces by manually tracing the anatomical drawing of facial muscles in the FACS manual, RStudio was used to generate the boxplots, MRIcroGL was used to overlay the results on the brain slices, and Affinity Designer was used to refine the final figure.
