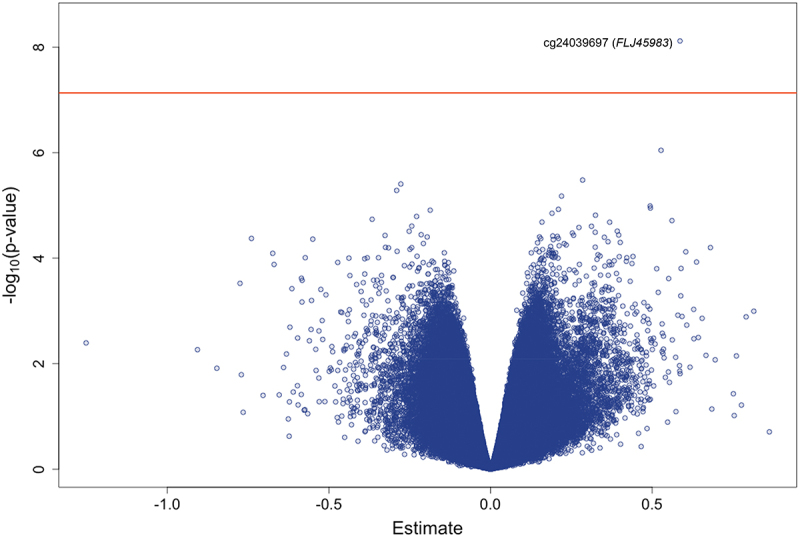
Figure 2.

Volcano plot of the epigenome-wide association between log2transformed father’s toenail arsenic concentrations (μg/g) and DNA methylation levels (M-values) in dural tissue samples from infants with spina bifida, adjusting for infant age at collection (days), infant sex, maternal serum folate levels (ng/mL), and surrogate variables. The red horizontal line represents the Bonferroni threshold.
