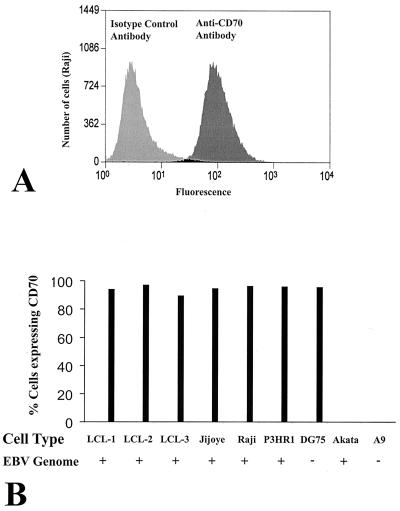
FIG. 1.
Expression of CD70 on LCLs and BLs. The presence of surface CD70 in various cell lines was quantitated by FACS. (A) The level of fluorescence of Raji cells stained with a CD70 antibody versus that of Raji cells stained with an isotype control antibody is shown. (B) A bar graph of the percentage of CD70-positive stained cells is shown using three LCLs (LCL-1, -2, and -3), three type III latency EBV-positive BL lines (Jijoye, Raji, and P3HR1), an EBV-negative BL line (DG75), a type I latency EBV-positive BL line (Akata), and a murine epithelioid fibroblast line (A9).

