. 2024 Oct 20;12(10):e009762. doi: 10.1136/jitc-2024-009762

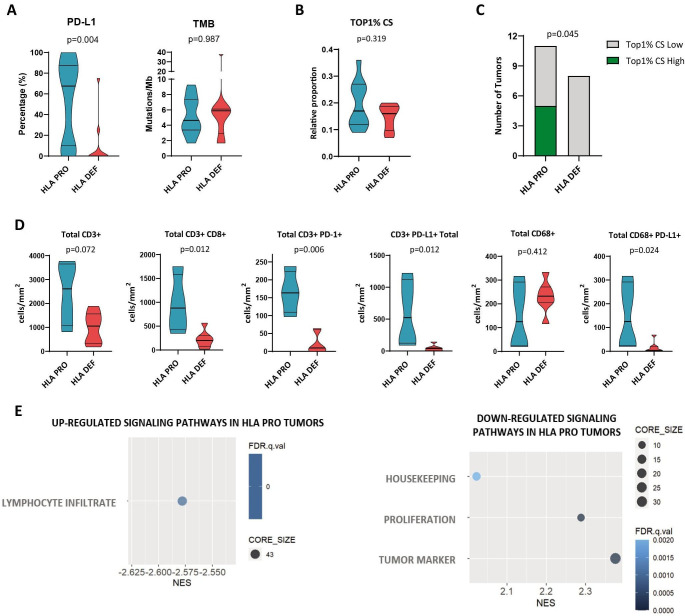
Figure 2. Tumor HLA class I status influence baseline tumor microenvironment. (A) Tumor proportion score (TPS) of PD-L1 (n=22), TMB levels (n=22). (B) Top 1% CS in HLA-DEF and PRO tumors (n=19). T cell clonotypes were ranked according to their frequency as the Top 1% most frequent clonotypes. (C) Patients with HLA-DEF and PRO classified as high or low Top 1% CS. A high CS of the Top 1% was defined using a 20% threshold. (D) Density of total T-cells (CD-3+), cytotoxic T-cells (CD3+CD8+), PD-1+T cells (CD3+PD-1+), PD-L1+T cells (CD3+PD-L1+), macrophages (CD68+) and PD-L1+macrophages (CD68+PD-L1+) (n=11 for all immune cell populations). (E) Gene set enrichment analysis for HLA class I status. Differentially upregulated and downregulated pathways in HLA-proficient (n=7) and HLA-deficient (n=5) pretreatment tumors. Non-parametric Mann-Whitney test was used for comparisons. An adjusted p value of<0.05 was considered statistically significant. FDR, False Discovery Rate; HLA, human leukocyte antigen; HLA-DEF, HLA-deficient; HLA-PRO, HLA-proficient; NES, Normalized Enrichment Score; PD-L1, programmed death ligand 1; TMB, tumor mutational burden; Top 1% CS, Top 1% clonal space.

Figure 2