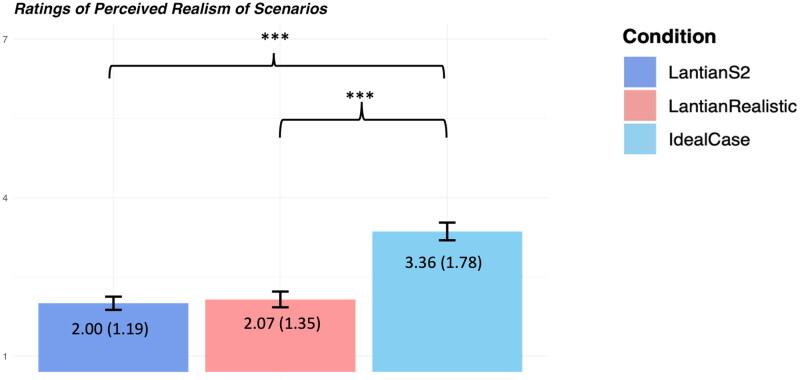
Figure 2.
Perceived realism. Note: Error bars represent 95% confidence intervals around the mean. The number of asterisks indicates the level of statistical significance: *p < 0.05, **p < 0.01, ***p < 0.001. Means and standard deviations are listed on top of the bars (standard deviation in parenthesis).

