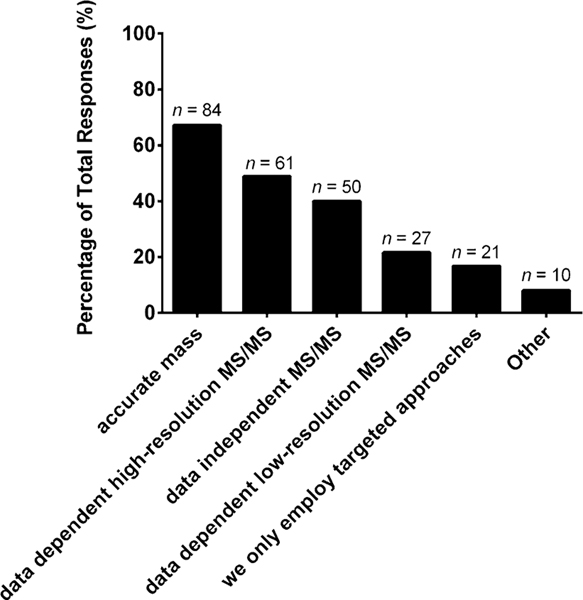
Fig. 7.
“What data acquisition methods does your laboratory incorporate for untargeted studies (select those that apply)?” The values are shown as a percentage of total responses (total number of laboratories responding, n = 125). The overall total number of responses was 316. The number of responses are indicated in the figure above the solid bars. The x axis labels reflect the survey multiple choice response options. Note that for this question, laboratories had the option to self-identify with more than one option

