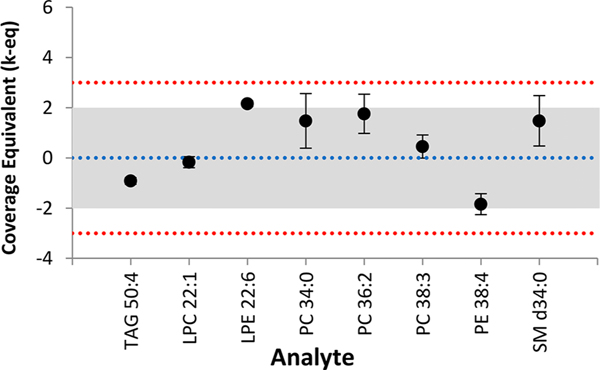
Figure 2.
Example control plot. Results are presented as normalized coverage equivalents (k-eq) at the mean (data points) and standard deviation (error bars). The blue dotted line represents the consensus mean. The middle shaded region represents the 95% expanded uncertainty interval for the NIST-ILCE consensus mean estimate; the red dotted lines bound the 99% expanded uncertainty.

