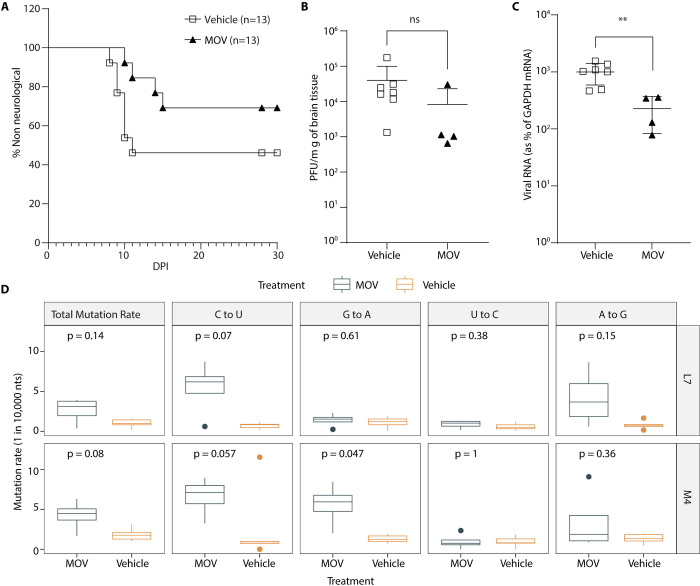
Fig 4. Molnupiravir (MOV) treatment increases survival after infection via an IN route.
(A-C) A mix of both male and female C57BL/6 mice at the age of day 23 to 25 were infected with LACV (1x10² pfu/mouse) through an IN route. Mice were treated orally with MOV (300 mg/kg, n = 13) or DMSO (n = 13) twice daily until the onset of clinical signs or 10 dpi, starting at day 0 (2 hrs prior to infection) and followed for development of clinical disease. Kaplar-Meier analysis was used to calculate the difference of clinical disease and statistical analysis (A). Brain tissue was harvested after animals showed clinical signs of the disease from the experiments (A). Out of 13 mice, 7 mice showed clinical signs in vehicle treated group, whereas 4 mice were clinical in MOV treated group. To quantify the virus in brain tissue we used (B) a plaque assay for quantifying infectious virus titer and (C) qRT-PCR for viral RNA (n = 7 for vehicle control and n = 4 for MOV treatment). Lines and error bars for each set indicate mean ± S.D. (D) Mutation density of LACV in brain tissue in presence (n = 4) or absence (vehicle, n = 7) of MOV treatment was measured by MPID-NGS in two sequenced regions (L7 and M4). On the boxplots, the middle lines indicate the medians of the values, top and bottom parts of the boxes indicate the inter-quartile rage (IQR), the lines extending to the lowest and highest values indicate the range of 1.5*IQR, and the “*” symbols indicate the mean values of the mutation rate. Statistical comparisons in panel (B-D) were performed using Mann-Whitney U test.

