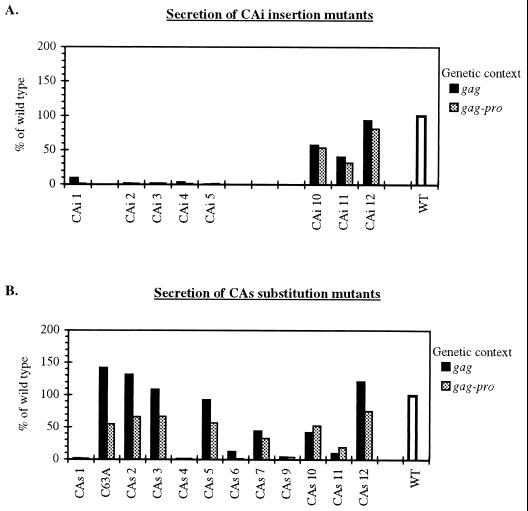
FIG. 3.
VLP secretion levels of the HTLV-1 CA mutants expressed in gag and gag-pro genetic contexts. (A) CAi mutants; (B) CAs mutants. Dark bars indicate results in gag context (mean values of two independent experiments); gray bars indicate results in gag-pro context (mean values of three independent experiments). For each genetic context, all CAi and CAs mutants were analyzed in parallel.

