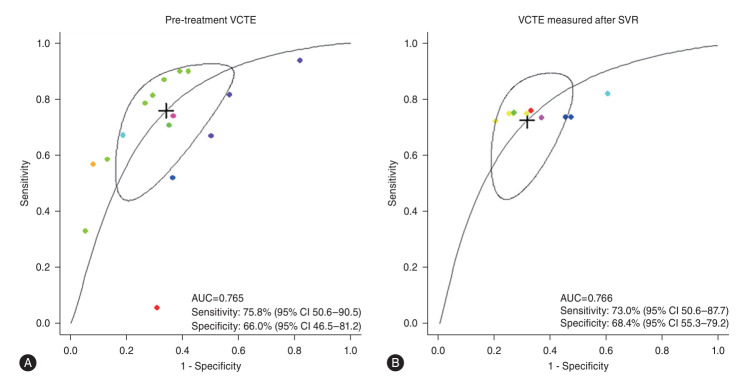
Figure 2.
The performance of VCTE for predicting HCC after the achievement of SVR. Multiple-threshold sROC curve of pre-treatment VCTE (A) and VCTE measured after SVR (B). sSROC, summary receiver operating characteristic curve; VCTE, vibration-controlled transient elastography; SVR, sustained virological response; HCC, hepatocellular carcinoma; CI, confidence interval.

