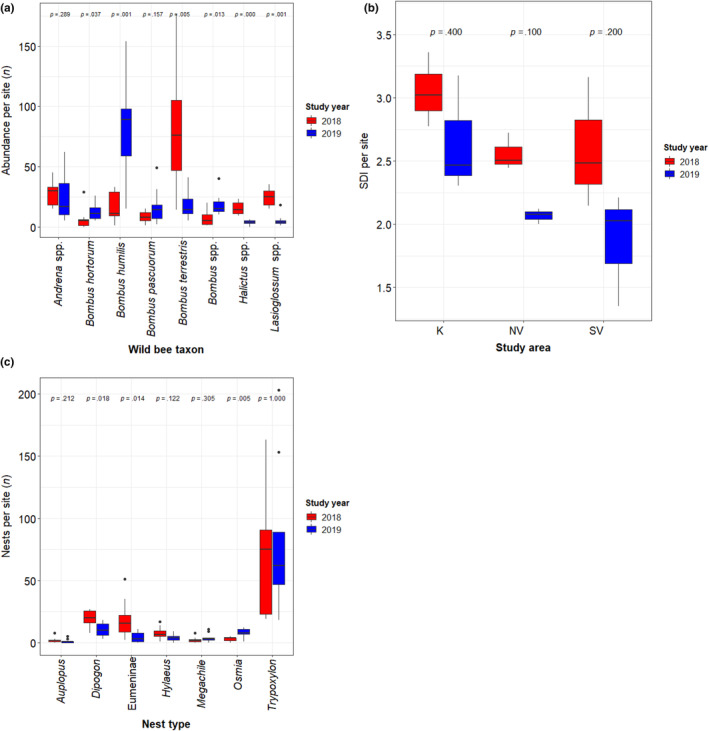
FIGURE 3.

Changes in (a) the abundances per site of the eight most common wild bee taxa, (b) the Shannon Diversity Index (SDI) per site regarding all wild bee species for the three study areas, and (c) the numbers of nests per site and seven different Hymenopteran nest types between the two study years, which were tested for significance using non‐parametric Wilcoxon signed‐rank tests (p‐values on top of the figures).
