FIGURE 3.

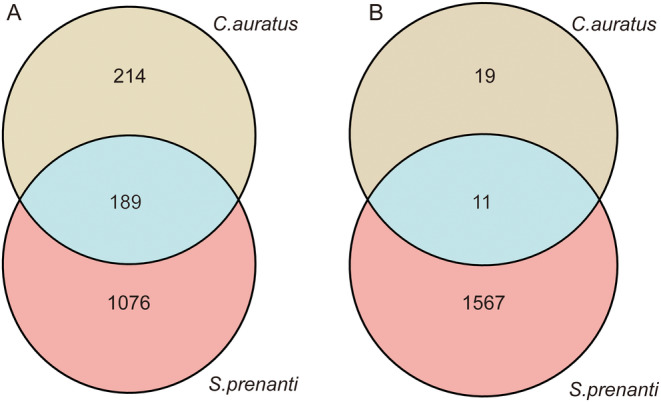
Venn diagram showing the number of DEGs identified from each treatment. Shared DEGs and DEGs uniquely identified in liver tissue (A); Shared DEGs and DEGs uniquely identified in tail muscle tissue (B).

Venn diagram showing the number of DEGs identified from each treatment. Shared DEGs and DEGs uniquely identified in liver tissue (A); Shared DEGs and DEGs uniquely identified in tail muscle tissue (B).