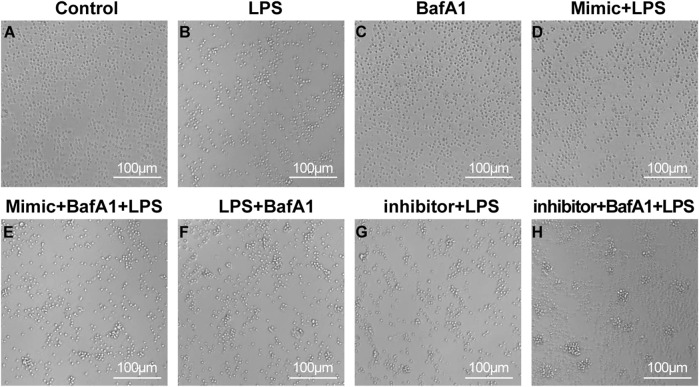
FIGURE 2.
The survival state of CD4 + T lymphocytes after various interventions under the micro-scope. (A–H) The cell morphology was control group, LPS group, BafA1 group, mimic + LPS group, mimic + BafA1 + LPS group, LPS + BafA1 group, inhibitor + LPS group and inhibitor + BafA1 + LPS group, respectively.

