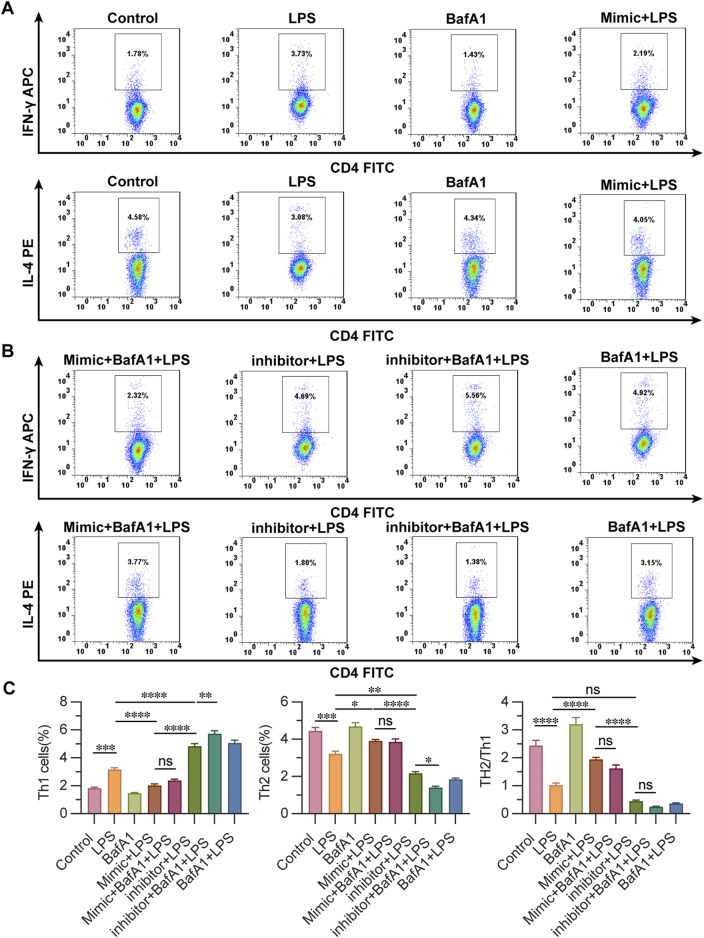
FIGURE 5.
Detection of the ratio of Th2/Th1 differentiation of CD4+ T lymphocytes using flow cytometry. (A, B) observation of the ratio of Th2/Th1 differentiation of CD4+ T lymphocytes by flow cytometry in groups. (C) The ratio of Th1 cells and Th2 cells by flow cytometry in groups. Results are represented as mean ± SEM, n = 3. *, **p < 0.05, ***p < 0.001, ****p < 0.0001, ns p > 0.05.

