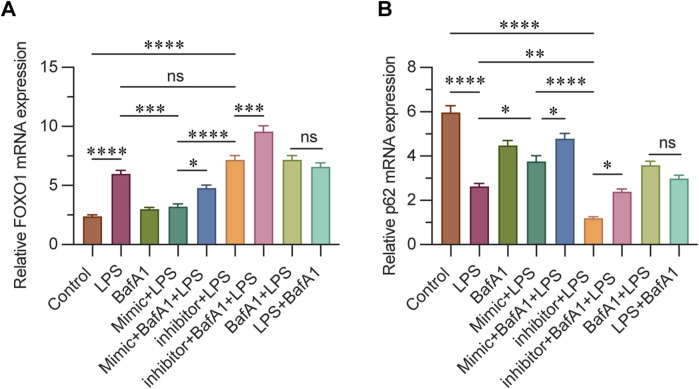
FIGURE 6.
(A) Relative mRNA levels of FOXO1 in each group were determined using qPCR. (B) Relative mRNA levels of P62 in each group were determined using qPCR. β-actin was used as the loading control. Results are represented as mean ± SEM, n = 3. *, **p < 0.05, **p < 0.01, ***p < 0.001, ****p < 0.0001, ns p > 0.05.

