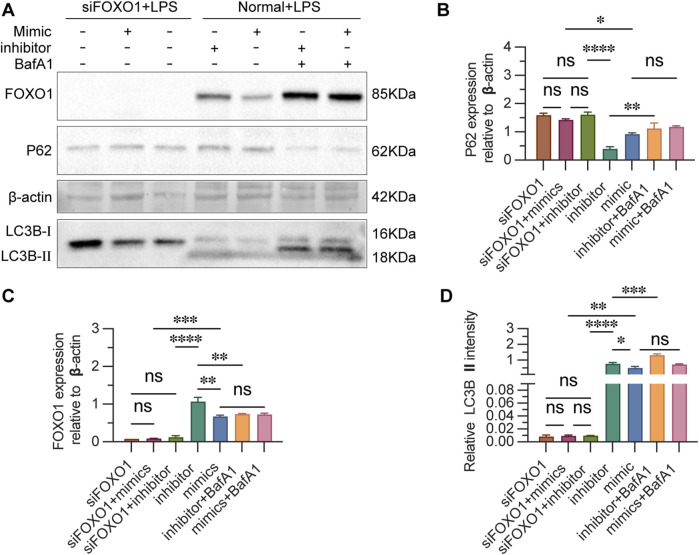
FIGURE 8.
Estimation of FOXO1 and autophagy-related proteins after si-FOXO1 transfection. (A) Western blot analysis of the expression of FOXO1 and autophagy-related proteins. (B) The results are reported as the relative intensity values of p62in each group. (C) The ratios are reported as the intensity values of FOXO1 in each group. (D) The results are reported as the relative intensity values of LC3B Ⅱ in each group. β-actin was used as the loading control. Results are represented as mean ± SEM, n = 3. *p < 0.05, **p < 0.01, ***p < 0.001, ****p < 0.0001, ns p > 0.05.

