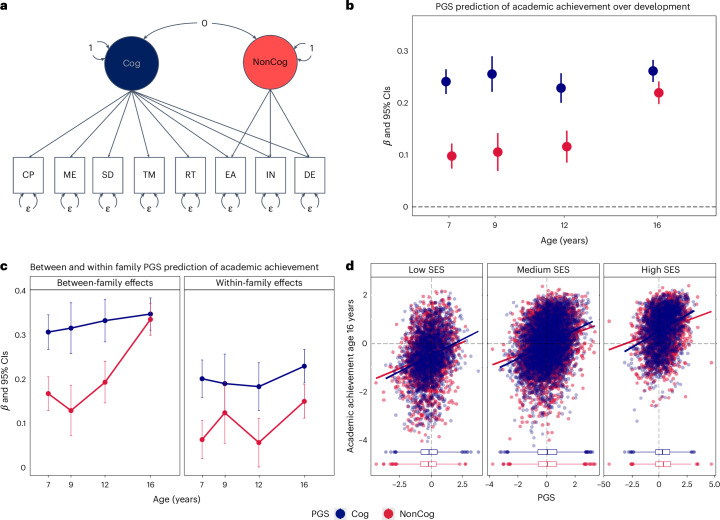
Fig. 3. Contribution of NonCog genetics to academic development: genomic analyses and gene–environment interplay.
a, Path diagram for the extension of the GWAS-by-subtraction model implemented in genomic SEM (Methods). In addition to GWAS summary statistics for cognitive performance (CP) and educational attainment (EA), summary statistics of memory (ME), symbol digit (SD), trail making (TM) and reaction time (RT) GWASs loaded on the Cog latent factor while GWAS summary statistics for income (IN) and deprivation (DE) loaded on the NonCog latent factor, in addition to EA (Methods). b, Cog (blue) and NonCog (red) polygenic score (PGS) prediction of academic achievement at ages 7,9, 12 and 16 years. Point estimates represent beta coefficients and error bars are 95% Cl, N of clustered observations 6,575 at age 7, 3,144 at age 9, 4,445 at age 12 and 7,307 at age 16 years. Each cluster comprised twin siblings and non-independence was accounted for using generalized estimating equation. c, The results of PGS analyses after partitioning the effects of Cog and NonCog into between and within-family factors. Point estimates represent beta coefficients and error bars are 95% CI. d, Cog and NonCog PGS prediction of academic achievement at the end of compulsory education (age 16 years), plotted at different levels of family socio-economic status (SES): low (<25th percentile), middle (middle 50% interquartile range) and high (>75% percentile). The box plots show median interquartile range (middle 50%), minimum, maximum and outliers for Cog (blue) and NonCog (red), respectively. N ranging from 3,001 to 7,019, exact N for each regression analysis are reported in Supplementary Table 19.

