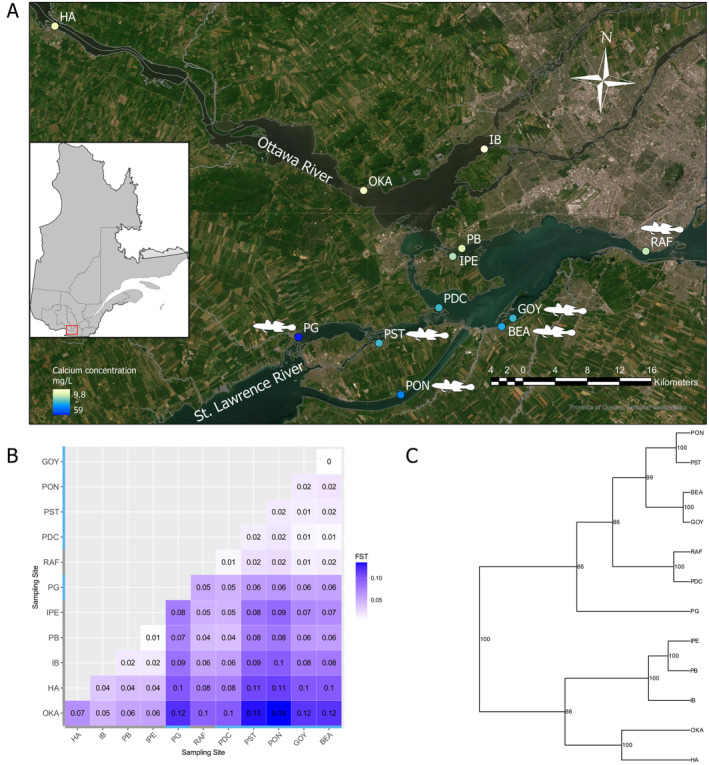
FIGURE 1.

Study site locations in the Upper St. Lawrence River system and results of the population structure. (A) The study sites are located near the island of Montreal, QC, Canada (right of the map). Sites are colored based on water calcium concentration (mg/L). Sites with low calcium and round gobies absent are HA‐LCGA, OKA‐LCGA, IB‐LCGA, PB‐LCGA, and IPE‐LCGA while sites with high calcium and round gobies present are PG‐HCGP, PST‐HCGP, PON‐HCGP, BEA‐HCGP, and GOY‐HCGP. The two exceptions are RAF‐LCGP (low calcium and round gobies present) and PDC‐HCGA (wetland, high calcium, and round gobies absent), which have inverted patterns. (B) Pairwise F ST matrix between the 12 study populations based on non‐outliers SNPs. The gray bars correspond to the Ottawa River populations (LCGA) and the blue bars to the St. Lawrence populations (HCGP), except for PDC (HCGA, wetland refuge) and RAF (LCGP). (C) Phylogenetic relationships between populations are shown as an UPGMA tree, with numbers indicating support for each node based on 1000 bootstraps.
