
FIGURE 4.
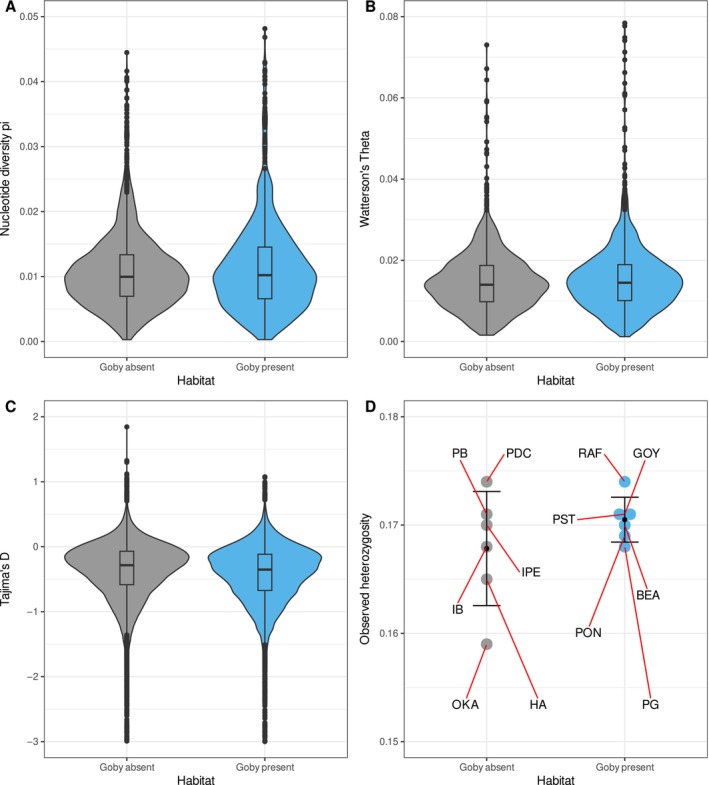
Genome‐wide diversity indices. (A) Violin plots of nucleotide diversity pi, (B) Watterson's Theta, (C) and Tajima's D according to predation level (round goby absent/present), with median and interquartile ranges shown in the box plot insert. (D) Observed heterozygosity per population, comparing round goby‐impacted and refuge populations.