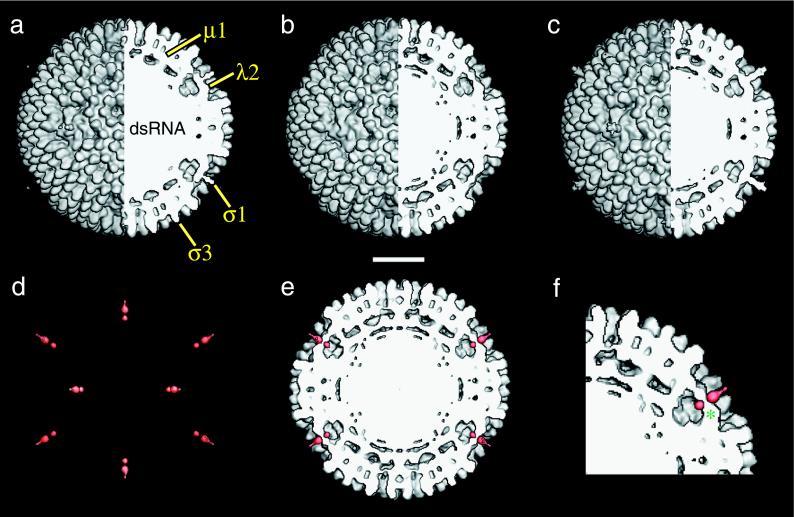
FIG. 2.
Image reconstruction of r-cores+ς1. (a to c) Composite images comprising external (left half) and cutaway (right half) surface-shaded representations of virions (a), r-cores (b), and r-cores+ς1 (c) are shown. Features attributed to outer capsid proteins and the genome are labeled in panel a. (d) Difference map between r-cores+ς1 and r-cores. Only density features in the front half of the map are shown and are coded in red. (e) The difference map (red) superimposed upon a cutaway section of the r-core map. Features in the difference map at positions above and below the sectioning plane are not shown. (f) Magnified view of a portion of the image in panel e. One segment of the pentameric shutter that closes the λ2 turret is labeled (*). Scale bar, 200 Å.

