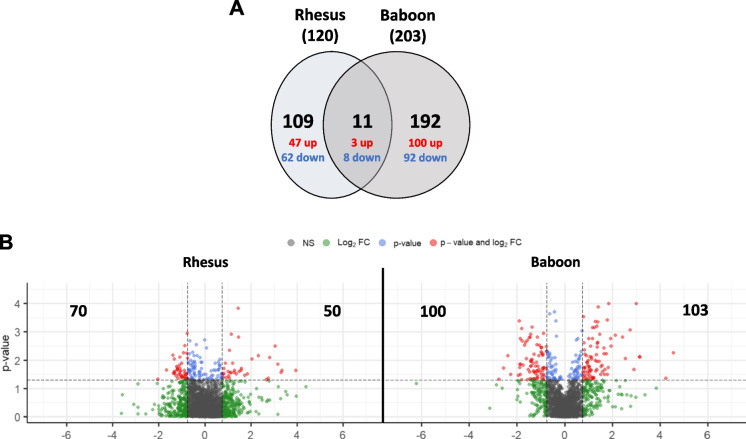
Fig. 1.
Differentially expressed proteins (DAPs) in aged vs. young rhesus macaques and aged vs. young olive baboons. A Venn diagram showing the number of shared and unique DAPs in each NHP species; B Volcano plots showing the distribution of DAPs. The x-axis shows log2-transformed protein fold changes, the y-axis shows -log10-transformed p-values; a total of 120 DAPs and 203 DAPs were identified for aged rhesus macaque and olive baboon groups, respectively

