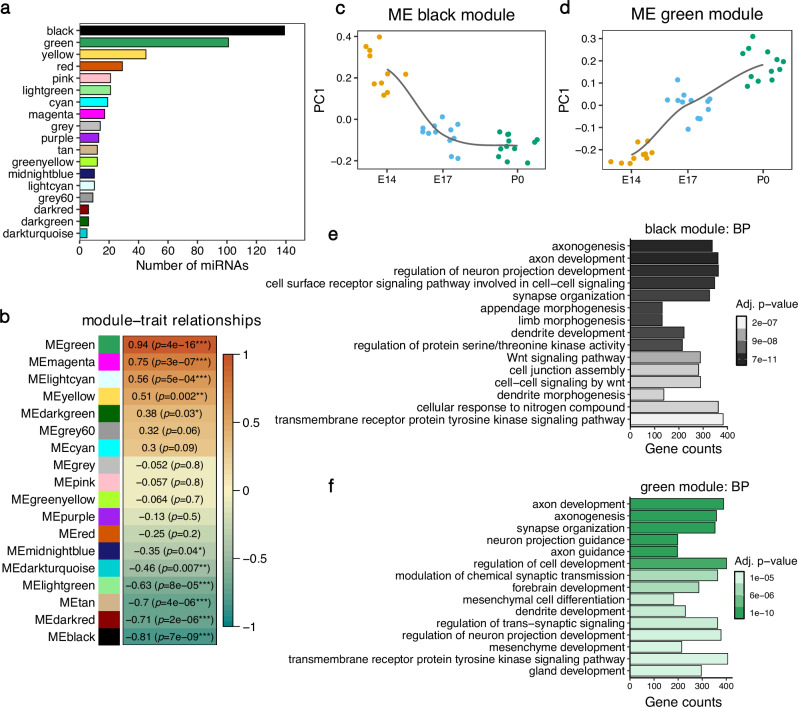
Fig. 3. Weighted miRNA co-expression analysis.
The co-expression network was derived using bulk small RNA-seq from mouse cerebral cortices at E14, E17 and P0. a Bar plot showing the number of miRNAs in each co-expression network module. b Pearson correlation between developmental stages of the mouse cerebral cortex (E14, E17 and P0) and the module eigengenes (ME). ***p < 0.001, **p < 0.01, *p < 0.05. c, d Module eigengene values at each developmental stage for the black and green module. n = 10 biological replicates at E14, n = 12 in all remaining groups. e, f Top 15 enriched GO terms for the biological process (BP) category for the gene targets of the black and green modules.

