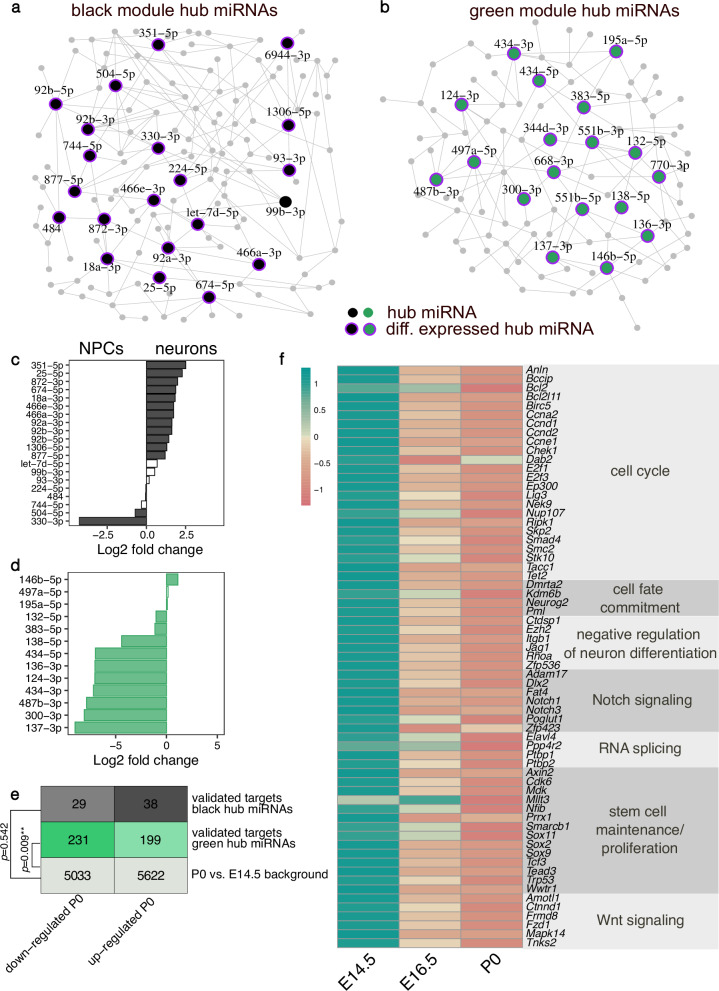
Fig. 4. Hub miRNAs in the black and green WGCNA modules.
Network plot showing the hub miRNAs in the black (a) and green (b) modules. Hub miRNAs are represented as bigger nodes. Purple halos around the nodes indicate miRNAs that are significantly differentially expressed between E14 and P0. Differential expression of hub miRNAs from the black (c) and green (d) module detected in the NPCs versus neurons analysis. Positive log2 fold changes indicate an upregulation in NPCs, negative values correspond to upregulation in neurons. White bars indicate non-significant fold changes. e Distribution of differentially expressed genes in the mouse cerebral cortex between E14.5 and P0. The overall number of genes as well as the number of these genes that are validated targets from miRNAs in the black and green module as obtained from miRTarBase are given. The comparison of the distribution of differentially expressed targets of the black or green module from the overall distribution of differentially expressed genes was performed with a Fisher’s exact test. f Z-score transformed average expression of selected validated targets of miRNAs from the green module that are significantly upregulated at E14.5 compared to P0. The expression values in (e) and (f) were obtained from the bulk RNA-seq of the mouse cerebral cortex across development study by Weyn-Vanhentenryck et al.37.

