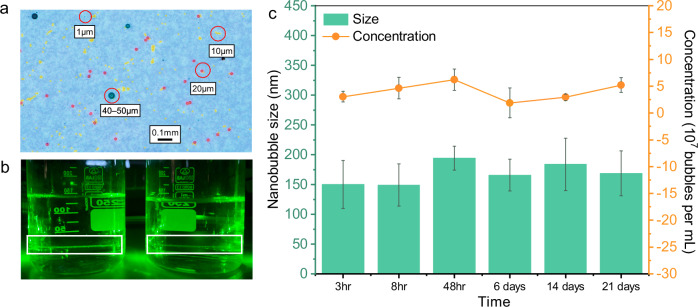
Fig. 2. Visualization and characterization of NBs in DI water.
a PS MPs under microscopy, with different sizes color-coded: Green for 40–50 µm; Orange for 20 µm; Yellow for 10 µm; Blue for 1 µm. Red circles highlight examples of MPs of various sizes. b Differentiation of DI water from NB water by dynamic light scattering, using a green laser pointer, as indicated by the white rectangle. c Changes in NBs’ size and concentration over 21 days. Data points and error bars represent the mean and standard deviation of three measurements.

