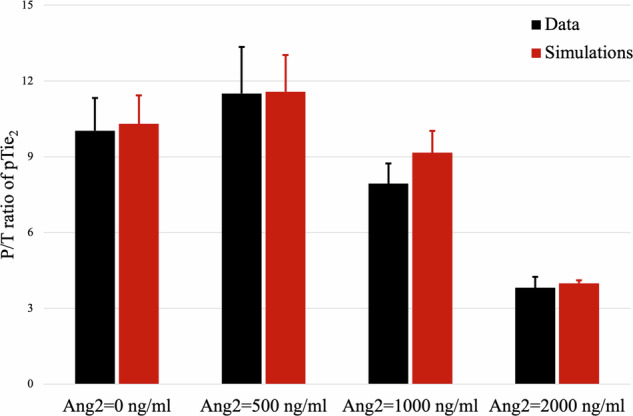
Fig. 2. Ang2 antagonizes the activity of Ang1.

Comparison between in-vitro (black) and in-silico (red) values of the P/T ratio (phosphorylated/total Tie2). In-vitro data are taken from Figure 6B in ref. 3. In-silico results are obtained by simulating for 30 min the angiopoietin module given by Eq. (1) with hAng2 = 0. Each pair of columns refers to the results obtained for the value of the initial Ang2 concentration indicated below the columns. Means ± std in the simulations are obtained by varying the initial concentration of Tie2, which was not indicated in the experimental data. The concentration of Ang1 is held fixed at 100 ng/ml.
