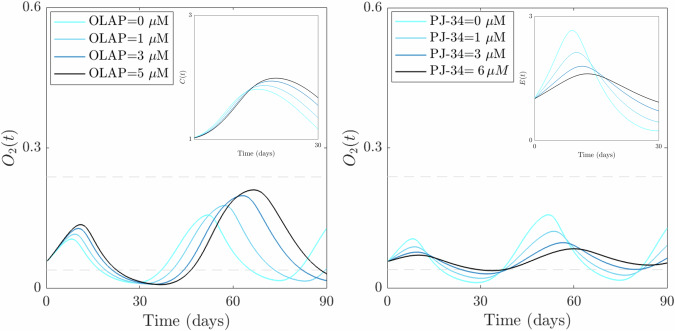
Fig. 8. PARP inhibitor effects on the emergence of slow-cyclic hypoxia.
Qualitative results of the evolution of systems (1)-(2)-(3) in the advanced-stage tumor case for increasing doses of PARP inhibitors. The left plot shows the qualitative evolution of O2 when OLAP impact on tumor proliferation is considered in the control case (the lightest blue line) and for increasing doses of the drug. The inset shows a zoom-in of tumor evolution in the time interval [0,30] days, where the first cycle of hypoxia emerges. The right plot shows the qualitative evolution of O2 when PJ-34 impact on EC proliferation is considered in the control case (lightest blue line) and for increasing doses of the drug. The inset plot shows the corresponding EC evolution in the time interval [0,30] days, where the first cycle of hypoxia emerges.

