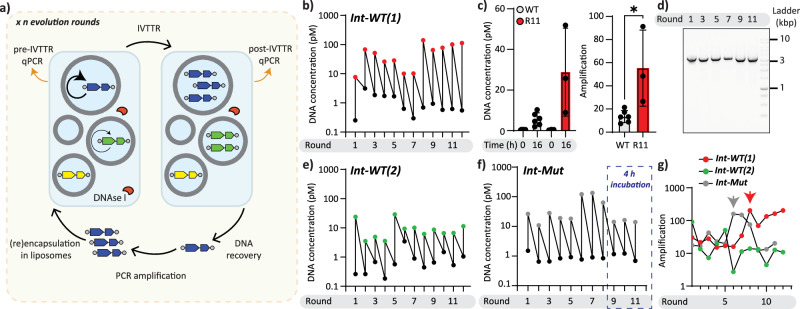
Fig. 2. Intermittent evolution of mod-ori-p2p3 and mod-ori-p2(F62Y)p3.
a Schematic illustration of the experimental set-up for the intermittent evolution campaign of DNA self-replicators. b Trajectories of mod-ori-p2p3 concentrations in liposomes in the intermittent evolutionary campaign, Int-WT(1). DNA was quantified by qPCR using primers that target a region in the p2 gene. c Comparison of in-liposome IVTTR in WT and pooled DNA population from Int-WT(1) at evolution round 11 (R11). Data are presented as mean (bar height) ± standard deviation values from three to six biological replicates. *P < 0.05. d Size analysis of IVTTR and PCR-amplified DNA during Int-WT(1) by agarose gel electrophoresis. e Trajectories of mod-ori-p2p3 concentrations in liposomes in the intermittent evolutionary campaign, Int-WT(2). f Trajectories of mod-ori-p2(F62Y)p3 concentrations in liposomes in the intermittent evolutionary campaign, Int-Mut. The last three evolution rounds, where IVTTR incubation time was reduced from 16 to 4 h, are highlighted with a blue dashed line. g DNA amplification trajectories of all three evolutionary campaigns. The arrows indicate the evolution round at which the replication ability improved. Source data are provided as a Source Data file.

