
Fig. 1.
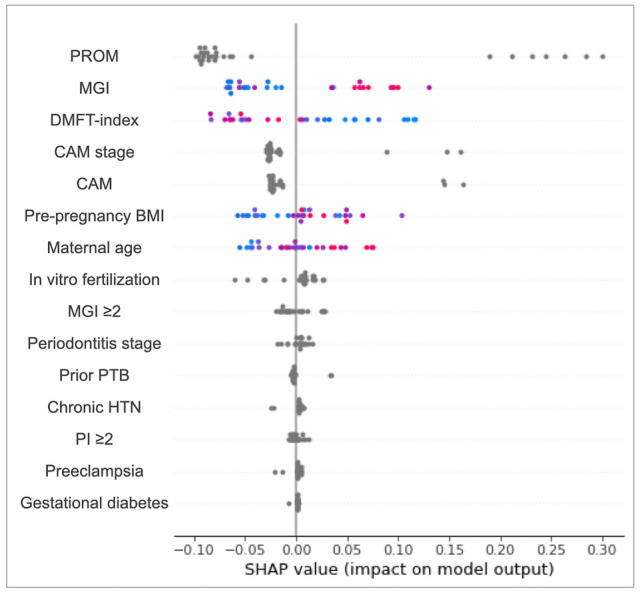
Shapley additive explanation (SHAP) summary plot for PTB. Blue (or red) color denotes the low (or high) index value of a major predictor of a participant. A positive (negative) SHAP value indicates that the independent variable increases (decreases) the probability of PTB when included in the model as a predictor. PROM, prelabor rupture of the membranes; PTB, preterm birth; MGI, modified gingival index; DMFT, decayed, missing, filled teeth; CAM, chorioamnionitis; BMI, body mass index; HTN, hypertension; PI, plaque index.