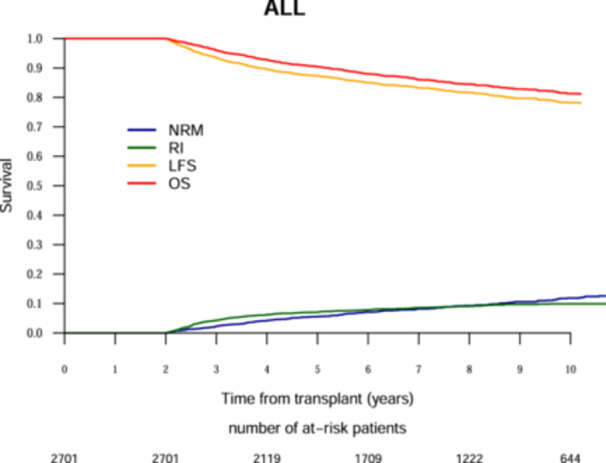
Figure 1.

Ten‐year outcomes analysis after allogeneic hematopoietic cell transplantation for acute lymphoblastic leukemia. The red line represents overall survival (OS), the orange line represents leukemia‐free survival (LFS), the green line represents relapse incidence (RI), the blue line represents nonrelapse mortality (NRM).
