. 2024 Feb 24;25(10):857–877. doi: 10.1631/jzus.B2300401

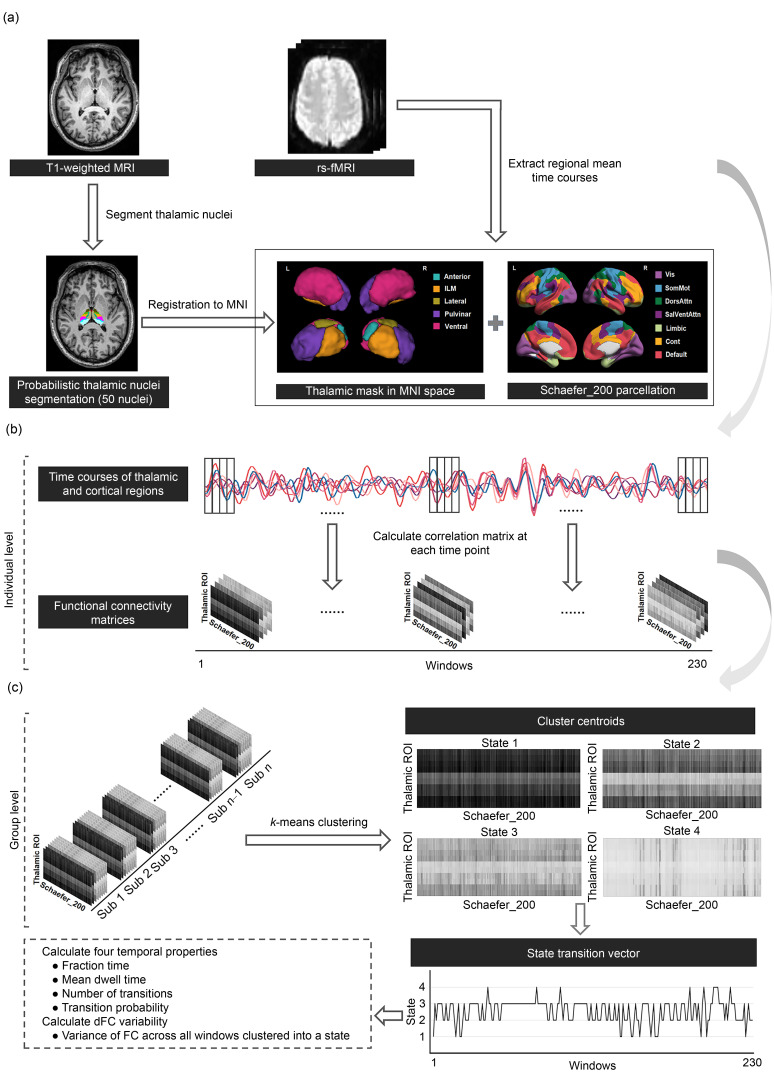
Fig. 1. Pipeline of dynamic functional connectivity (dFC) analysis in thalamocortical connectivity. (a) Identification of thalamic and cortical regions. The thalamus was segmented into 50 thalamic nuclei using a probabilistic thalamic segmentation algorithm in FreeSurfer. Then, the 50 nuclei were grouped into five thalamic subregions for each side (including anterior thalamus (Anterior), lateral thalamus (Lateral), ventral thalamus (Ventral), intralaminar/medial thalamus (ILM), and pulvinar thalamus (Pulvinar)), and spatially normalized to the Montreal Neurological Institute (MNI) space. The 200 cortical regions were defined by the Schaefer atlas, which was categorized into seven networks including visual network (Vis), somatomotor network (SomMot), dorsal attention network (DorsAttn), salient ventral attention network (SalVentAttn), limbic network (Limbic), executive control network (Cont), and default mode network (Default). The regional mean time courses of ten thalamic regions and 200 cortical regions were extracted. (b) Estimation of thalamocortical dFC patterns. The auto-regressive dynamic conditional correlation (AR-DCC) model was used to obtain 230 correlation matrices (10×200) for each participant. (c) Thalamocortical dFC state analysis. Correlation matrices of all participants were clustered into four dFC states using the k-means clustering algorithm. Four temporal properties (i.e., fractional time, mean dwell time, number of transitions, and transition probability) and the dFC variability were calculated for analysis. MRI: magnetic resonance imaging; rs-fMRI: resting-state functional MRI; ROI: region of interest.

Fig. 1