. 2024 Feb 24;25(10):857–877. doi: 10.1631/jzus.B2300401

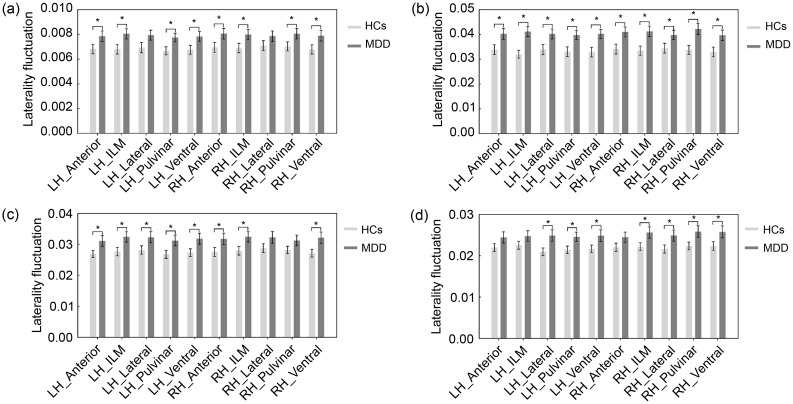
Fig. 3. Results of dynamic laterality analysis. (a) The laterality fluctuations (LFs) in thalamic connectivity with the whole cortex. (b‍–‍ d) LF in thalamic connectivity with the Cont (b), DorsAttn (c), and SalVentAttn (d) networks. * P FDR<0.05. Data are displayed as mean±standard error of the mean (SEM), n=48 (MDD) or n=57 (HCs). FDR: false discovery rate; LH: left hemisphere; RH: right hemisphere; Anterior: anterior thalamus; ILM: intralaminar/medial thalamus; Lateral: lateral thalamus; Pulvinar: pulvinar thalamus; Ventral: ventral thalamus; Cont: executive control network; DorsAttn: dorsal attention network; SalVentAttn: salient ventral attention network; HCs: healthy controls; MDD: major depressive disorder.

Fig. 3