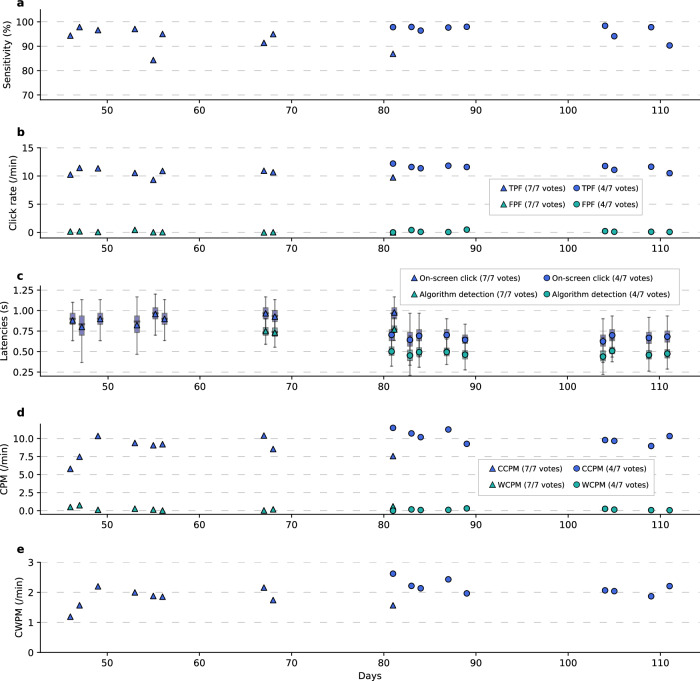
Fig. 4. Long-term switch scan spelling performance.
Across all subplots, triangular and circular markers represent metrics using a 7-vote and 4-vote voting threshold, respectively. a Sensitivity of click detection for each session. b True positive and false positive frequencies (TPF and FPF, which are represented by blue and green markers, respectively) were measured as detections per minute. c Latencies of grasp onset to correct algorithm detection (green markers) and on-screen click (blue markers). For each of the sessions using a 7-vote threshold, there were 284, 182, 372, 264, 451, 382, 233, 453, and 292 latency measurements, respectively. For each of the sessions using a 4-vote threshold, there were 135, 513, 591, 209, 289, 547, 511, 579, and 466 latency measurements, respectively. Mean latencies are shown as triangular or circular markers that are overlayed on top of box-and-whisker plots. The distribution of latencies across all spelling blocks in a session was used to compute the mean latency and box-and-whisker plot for that session. For each box-and-whisker plot, the median is shown as the center line, the quartiles are shown as the top and bottom edges of the box, and the whiskers are shown at 1.5 times the interquartile range. Using 7-vote and 4-vote voting thresholds, on-screen clicks happened an average of 207 ms and 203 ms, respectively after detection. Note that algorithmic detection latencies were not registered in the first six sessions. d Characters per minute (CPM) are assessed in terms of correct and wrong characters per minute (CCPM and WCPM, which are represented by blue and green markers, respectively). e Correct words per minute (CWPM).

