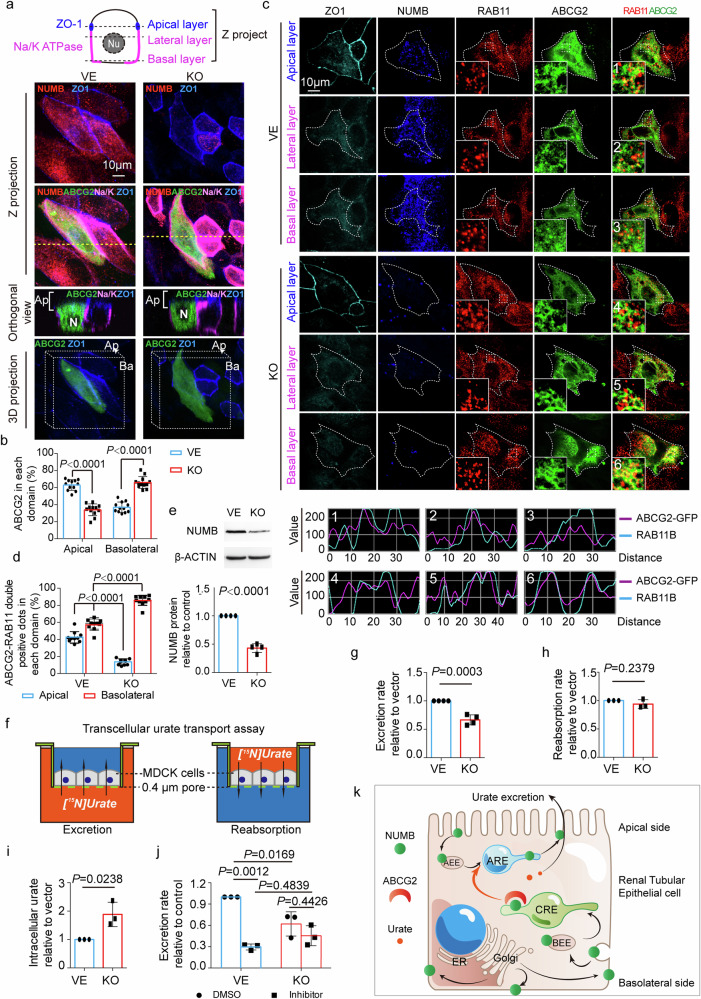
Fig. 3. NUMB-knockout abolished the apical distribution of ABCG2 which affects uric acid excretion.
a Distribution of ABCG2 in polarized NUMB-knockout MDCK cells and control cells. ABCG2-eGFP plasmid was transfected into NUMB-knockout (KO) or control (VE) MDCK cells. After reaching 100% confluence, the cells were maintained for another 3–5 days to establish a polarized monolayer. ZO-1 (blue), Na/K ATPase (magenta) and NUMB (red) were immuno-stained. The Z projection, orthogonal views and the 3D projection images are shown. N: nuclear; Ap: apical side; Ba: basolateral side. b Statistical comparison of the percentage of apical and basolateral ABCG2 between in NUMB-knockout and in control MDCK cells (n = 12 per group). c Co-distribution of ABCG2 (green) and RAB11 (red) in polarized NUMB-knockout MDCK cells and control cells. ZO-1 (cyan) was stained as an apical marker. Fluorescent signal intensity along lines in the amplified regions numbered with 1–6 are shown in the bottom panel. d Statistical comparison of ABCG2/RAB11-double positive signal in each cellular domain between in NUMB-knockout and in control MDCK cells (n = 10 per group). e Detection of NUMB protein in NUMB-knockout (KO) or control (VE) MDCK cells. The representative images of western blotting are shown in the upper panel. β-ACTIN was detected as the loading control. The detection was repeated four times. The statistic result is shown in the bottom panel (n = 4 per group). f Illustration of trans-cellular uric acid transport assay. g–i Statistical comparison of the excretion rate (g, n = 4), reabsorption rate of uric acid (h, n = 3) and the intracellular uric acid (i, n = 3) between in NUMB-knockout (KO) and in control (VE) MDCK cells. j Statistical comparison of uric acid excretion rate among NUMB-knockout (KO) and control (VE) MDCK cells treated with ABCG2 inhibitor or solvent DMSO (n = 3 per group). k Illustration of how NUMB direct ABCG2 to the apical membrane of RTECs. After synthesis, ABCG2 proteins are transported to the cell surface. ABCG2 proteins on the basolateral membrane are endocytosed and encapsulated within BEE, from where the encapsulated ABCG2 were sorted and transported to CRE. NUMB recognizes and binds to ABCG2 in CRE and directs ABCG2 to ARE. From ARE, ABCG2 is delivered to the apical surface. Statistics was calculated using two-tailed unpaired Student’s t-test (e, g–i) or Two-way ANOVA with Tukey’s Multiple Comparison Test (b, d, j). The results are presented as mean ± SD.

