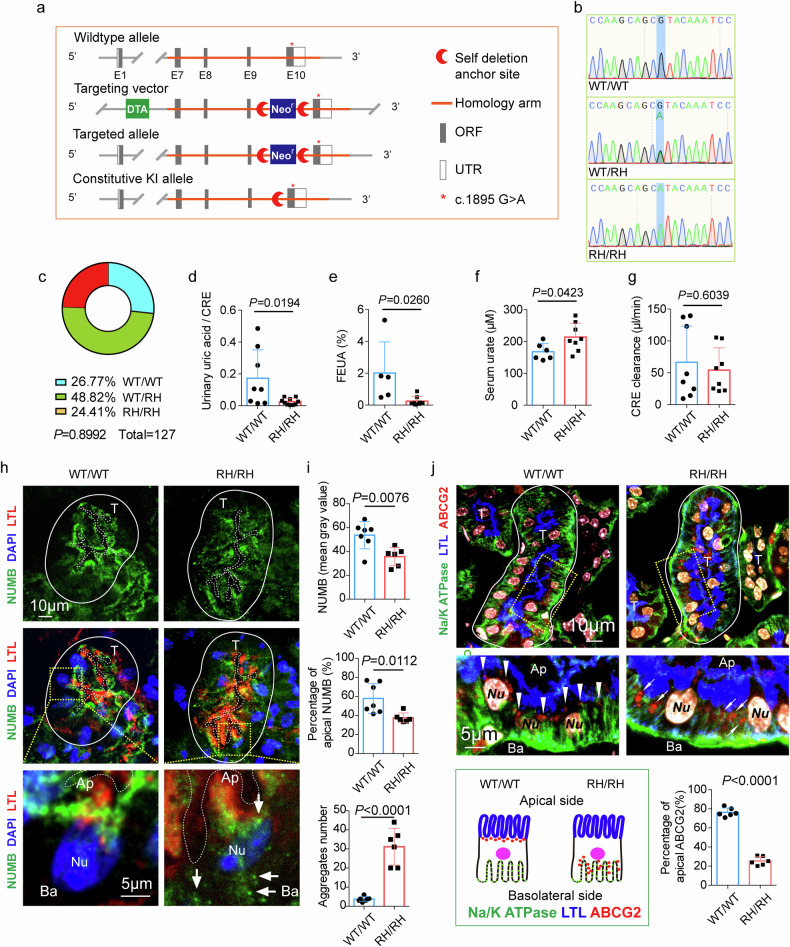
Fig. 5. The defection in uric acid excretion and the abnormal distribution of NUMB and ABCG2 protein in renal tubular epithelia cells of NUMBR632H/NUMBR632H homozygous mice.
a Illustration of the establishment of orthologous NUMBR632H mutation knock-in mice. b Representative electropherograms show the generation of mice heterozygous (WT/RH) or homozygous (RH/RH) for the introduced mutation (blue shadow). c Chi-square to compare observed and expected distributions of three genotype according to Mendel’s law. d–g Comparison of the ratio of urinary uric acid to urinary creatinine (d, WT/WT n = 8; RH/RH n = 10; t = 2.600, df = 16), the fractional excretion of uric acid (FEUA) (e, WT/WT n = 5; RH/RH n = 8; t = 2.570, df = 11), serum urate (f, WT/WT n = 6; RH/RH n = 8; t = 2.272, df = 12) and creatinine clearance (g, WT/WT n = 8; RH/RH n = 8; t = 0.5308, df = 14) between in WT/WT mice and in NUMBR632H/NUMBR632H (RH/RH) mice. h Representative images of immunofluorescence staining of NUMB in kidney tissue of WT/WT mice and NUMBR632H /NUMBR632H mice. The solid lines indicate the edge of renal tubules, and the dashed lines mark the lumen of renal tubules. T: renal tubules; Ap: apical side of renal tubular epithelia cells (RTECs); Ba: basolateral side of RTECs. White arrows indicate sporadic distribution of granule-like structure of NUMBR632H protein in cytoplasm of RTECs. i The statistic comparison of NUMB protein (top panel), apical NUMB (middle panel) and NUMB aggregate-like structure (bottom panel) each renal tubule between in WT/WT mice (n = 7) and in NUMBR632H/NUMBR632H mice (n = 6). j Representative images of immunofluorescence staining of ABCG2 and basolateral marker Na/KATPase. The white arrow heads indicate the distribution of ABCG2 (red). In WT/WT mice, ABCG2 is distributed to the apical side just beneath the LTL signal. However, in NUMBR632H /NUMBR632H mice, ABCG2 located to the basolateral side with increased co-localization with Na/K ATPase. The illustration of ABCG2 distribution is shown in the bottom left, and the statistic result of the percentage of apical ABCG2 is shown in the bottom right (n = 6 per group, t = 19.34, df = 10). Statistics was calculated using two-tailed unpaired Student’s t test. The results are presented as mean ± SD.

