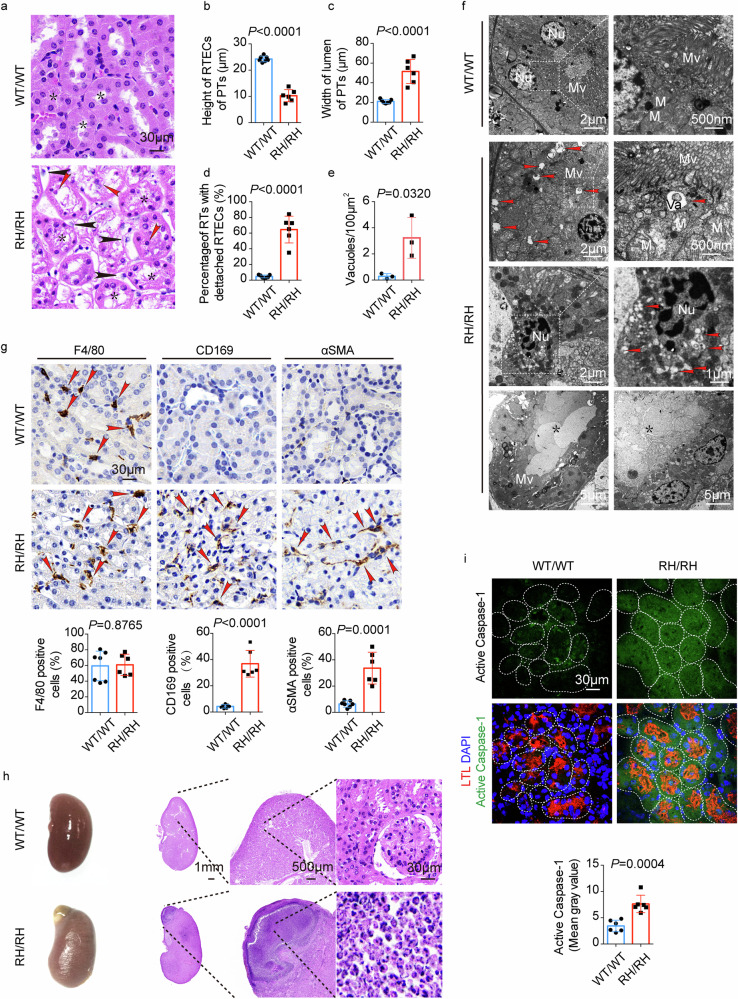
Fig. 6. Chronic uric acid nephropathy in NUMBR632H /NUMBR632H homozygous mice.
a H&E staining of the kidney tissue of WT/WT mice and NUMBR632H /NUMBR632H mice. The stars indicate the proximal tubules (PTs), the red arrow heads indicate the detached RTECs and the black arrow heads indicate the inflammatory cells infiltration. b–d Statistic comparison of the height of RTECs in PTs, the width of lumen of PTs and the percentage of renal tubules (RTs) with RTECs detached from basement membrane between in WT/WT mice (n = 7) and NUMBR632H /NUMBR632H mice (n = 6). e, f TEM images of renal tubules of WT/WT mice and NUMBR632H /NUMBR632H mice. Red arrow heads indicate vacuoles with diameter over 100 nm. Nu: nuclear; Mv: microvilli; M: mitochondria; Va: vacuole; star: non-cellular structures in the lumen. The statistic result of the amount of vacuoles with diameter over 100 nm per 100 μm2 is shown in e (n = 3, t = 3.228, df = 4). g Immunohistochemical staining of F4/80, CD169 and α-SMA. Red arrow heads indicate the positive cells. The statistic result of the percentage of F4/80+ (n = 6, t = 0.159, df = 11), CD169+ (n = 6, t = 8.428, df = 11) and α-SMA+ (n = 6, t = 5.870, df = 11) cells in total peritubular cells are shown in the bottom. h The representative gloss examination photos and H&E staining of renal tissue with severe inflammation in NUMBR632H /NUMBR632H mice. i Immunofluorescence staining of active Caspase-1. The tissues were also stained with LTL (red) and DAPI (blue). The statistic result of active Caspase-1 signal is show in the bottom panel (n = 6, t = 5.141, df = 10). Statistics was calculated using two-tailed unpaired Student’s t test (b–g, i). The results are presented as mean ± SD.

