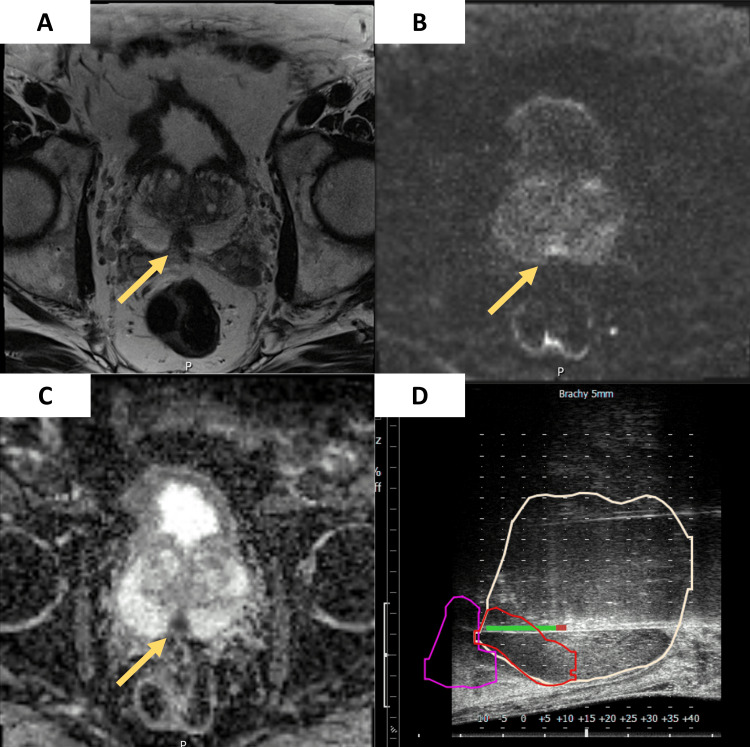
Figure 1. (A) Axial T2-weighted image with a nodular hypointense focal lesion (15 mm) in the peripheric zone (arrow). (B) On DWI with a high b value (1,400), a focal markedly hyperintense lesion (arrow). (C) With a markedly hypointense (arrow) value on the ADC map, consistent with a PI-RADS 5 lesion. (D) sagittal ultrasound view of the fusion-guided prostate biopsy, showing the prostate gland with the highlighted targeted lesion.
ADC: apparent diffusion coefficient, PI-RADS: Prostate Imaging Reporting and Data System, DWI: diffusion-weighted imaging

